September 2023 ENSO Outlook: An El Niño convo
Let’s cut right to the chase. According to the September El Niño-Southern Oscillation (aka ”ENSO”) Outlook, El Niño is expected to stick around (with greater than a 95% chance) at least through January-March 2024. There is now around a 71% chance that this event peaks as a strong El Niño this winter (Oceanic Niño Index ≥ 1.5 ˚Celsius). Remember, though, a strong El Niño does not necessarily mean strong El Niño impacts locally. Instead, it means a stronger chance that El Niño impacts will occur.
Let’s dive deeper into what’s going on across the Pacific in a patented ENSO Blog expert Q&A. And boy, oh boy, are you not going to believe who we were lucky enough to snag. Without further ado, introducing our two “experts”: the Pacific Ocean and the tropical atmosphere.
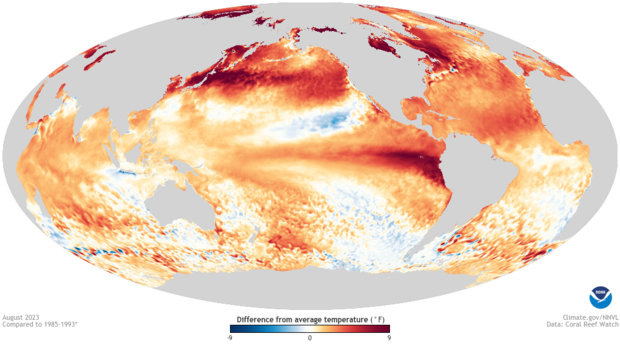
August 2023 sea surface temperature difference from the 1985-1993 average (details from Coral Reef Watch). Much of the global oceans are warmer than average. NOAA Climate.gov image from Data Snapshots.
ENSO Blog: Let’s start in the water. Pacific Ocean, big fan. Can you go over what “you” have been up to in the last month?
The Pacific Ocean: Hey, right back at you! It’s flattering that you have an entire blog dedicated to things going on in me. But let’s focus on what’s going on at my waist, what you call “the equator.” The main El Niño monitoring metric, the Niño-3.4 index—the average sea surface temperature in the central and eastern equatorial Pacific Ocean—was 1.3˚Celsius (2.3˚Fahrenheit) above the long-term average in August, up from 1˚C in July, according to the most reliable dataset, ERSSTv5 (long-term here is 1991-2020.) And the June-August Niño-3.4 index was 1.1˚C above the long-term average, making it the third consecutive three-month period in El Niño territory. And from what I’ve read on your blog, that means you are two more seasons away from an official “El Niño episode” in the historical record (the red in this table.)
Plus, judging from your weekly sea surface temperature datasets of my belly, the Niño-3.4 temperature anomalies are even higher during the first part of September, up to 1.6˚C.
EB: That’s pretty hot!
The Pacific Ocean: I’m pretty hot all over. In fact, my cousins the Atlantic, Indian, Arctic, and Southern Ocean are all pretty hot at the moment. Like record-breaking hot from April till now. So hot that the warmer-than-average ocean temperatures associated with El Niño happening in my central/eastern mid-section do not nearly stick out in the global picture as much as events in the past. It’s bonkers, if you ask me. The whole ocean was over 1˚C above the 20th-century average in August, the first time that’s happened in the 174-yr record. All us oceans have a fever!
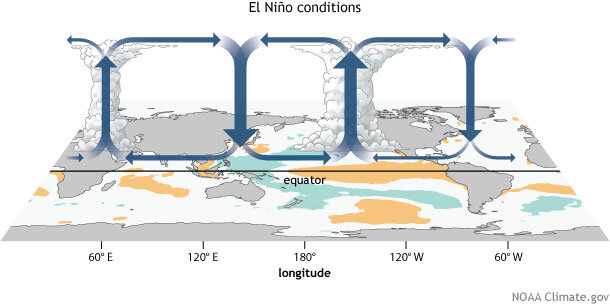
Generalized Walker Circulation (December-February) anomaly during El Niño events, overlaid on map of average sea surface temperature anomalies. Anomalous ocean warming in the central and eastern Pacific (orange) help to shift a rising branch of the Walker Circulation to east of 180°, while sinking branches shift to over the Maritime continent and northern South America. NOAA Climate.gov drawing by Fiona Martin.
EB: As we all know; El Niño doesn’t work if the atmosphere isn’t also playing. So, my next question is for the tropical atmosphere. What’s going on with you?
The tropical atmosphere: Thanks for having me. First-time guest, long-time reader. Believe me, El Niño’s got me all topsy-turvy. Normally when my Walker Circulation is acting like a well-oiled machine, there is rising, moist air over the warm western Pacific Ocean, sinking air over the eastern Pacific, and winds connecting those two branches: trade winds blowing east to west at the surface and west-to-east winds high up in the atmosphere. El Niño messes all of that up. And that’s what has been going on.
In August, the trade winds were weaker over the east-central equatorial Pacific. More thunderstorm activity than normal occurred farther east, extending from the international date line to the eastern Pacific Ocean, which is totally not where these storms typically reside. And then two important atmospheric metrics that you humans use, the Equatorial Southern Oscillation Index and the Southern Oscillation Index—which monitor how the surface air pressure changes between the western and eastern Pacific part of me—both were strongly negative in August, indicating an El Niño-like weakening of pressure in the eastern Pacific and higher than normal pressure in the west.
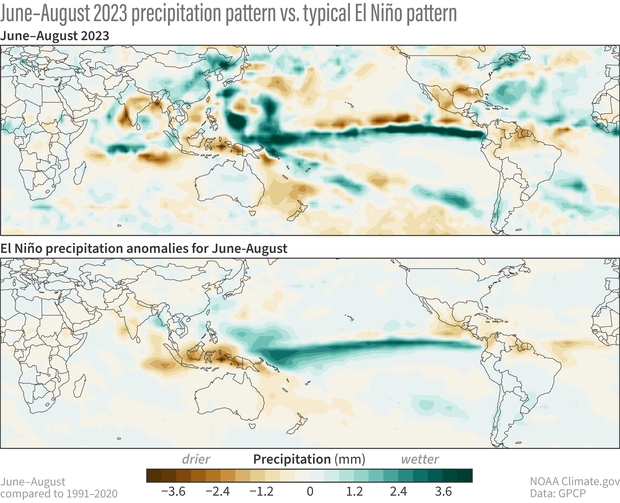
Comparison of the June-August 2023 precipitation anomaly patterns (top) to the El Nino patterns typical seen during June-August (bottom). June-August 2023 had similar patterns to that expected during El Nino. NOAA Climate.gov image based on image from Michelle L'Heureux using GPCP data.
EB: How similar have recent precipitation patterns been to El Niño?
The tropical atmosphere: Take a look at these images comparing the global precipitation anomalies from June-August 2023 to how I typically behave during El Niño. Oh, I’ve been very El Niño-like! Not only has precipitation been above-average across the equatorial Pacific Ocean, but it has also been below-average over northern South America, Central America, and parts of Indonesia and India.
Now, it’s not a perfect match. I know, I know…you’ll call me unreliable. Flighty. Chaotic, even. I prefer to say that I, the tropical atmosphere, never repeat myself. I give each El Niño its own special touch. Still, this year’s rainfall patterns are pretty close to previous years’ El Niños. In fact, based on a measure of pattern similarity between these two images, out of the 11 El Niño summers on record, June-August 2023 was the third-best match to what you all call the classic El Niño pattern (footnote #1). Only the summers of 1997 and 2015 were more like El Niño. Remember those events? Pretty big El Niños. So yeah, you could say that El Niño is having an impact on me.
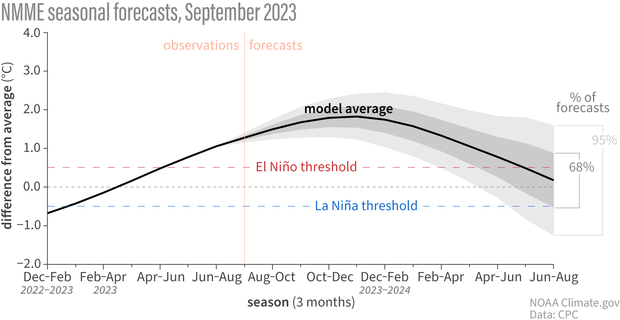
September 2023 climate model forecasts for the Niño-3.4 temperature anomaly in 2023-24 from the North American Multi-Model Ensemble (NMME). The black line shows the model forecast average; darker gray envelope shows the range of 68% of all model forecasts; lighter gray shows the range of 95% of all model forecasts. NOAA Climate.gov image based on a graph from Emily Becker.
The Pacific Ocean: How about we ask you a question now? ENSO Blog writer Tom, what can we, the Pacific Ocean and tropical atmosphere, expect from El Niño for the rest of the year?
Tom: Well, that’s a first. But great question! The global climate models we rely on are pretty certain that the currently observed warmer-than-average sea surface temperatures will last and even strengthen through winter 2023–24. After which, this El Niño event is expected to weaken, which is normal for these types of events.
The continued model confidence is one reason why forecasters have odds of over 70% that the current event will peak as a “strong” El Niño (Niño-3.4 index values greater than 1.5˚C) for the November-January average. There is even a 30% chance that Niño-3.4 values exceed 2.0˚C by this winter, which would put ocean temperatures in a tier with some of the strongest El Niños since 1950.
But to our readers, a few reminders from the ENSO Blog archive.
- You cannot blame EVERYTHING on El Niño.
- No two El Niños are alike, and the same goes for their impacts. And,
- Just because a strong event is forecasted does not necessarily mean strong impacts. Instead, El Niño can increase the chances for certain types of extremes.
That about does it for this month’s post on the ENSO Outlook. A special thanks to the Pacific Ocean and tropical atmosphere for taking some time out of their chaotic days and answering a few of my questions.
The Pacific Ocean: Of course! [waves goodbye]
The tropical atmosphere: An honor to be invited. [Blows a kiss]
Footnote
- If you look at the spatial (pattern) correlation coefficient between the two images, the coefficient is ~0.6, meaning that about 36% of the global spatial variability is explained by El Niño. This is a pretty large number as far as these things go!
Comments
Question
Before El Nino has an impact on the World's climate, doesn't the PDO have to phase positive ?
El Nino and positive PDO
I would not consider the positive phase of the PDO to be critical for El Nino's impacts - that's a bit like the tail wagging the dog. If we do see the expected El Nino impacts, particularly in the North Pacific and North America, then I would expect to see a shift toward a more positive PDO. However, if that occurs, it's likely a reflection of El Nino triggering the usual, stronger-than-normal Aleutian low, which then leads to changes of North Pacific sea surface temperatures consistent with the positive PDO. So, I generally would expect a shift of the PDO in the positive direction to accompany El Nino's expected impacts in the winter, but that doesn't mean that the positive PDO is the primary driver of the impacts.
PDO
PDO has been net negative for 16yrs
PDO
The PDO has been predominantly in the negative phase for quite a while now, as you noted, but when considering higher-frequency variability, there have been some recent periods in the positive phase, as shown here.
Global Temp Impact
Since the rest of the world (such as the Atlantic) is so much warmer than normal right now as well, does that mean that this ENSO cycle will have less of an effect on global temperatures than past ENSO cycles? I know that there is a 3-6 month lag on when global temps are impacted the most.
El Niño usually contributes…
El Niño usually contributes to a higher-than-average global average temperature (see this post). I expect that El Niño's contribution to what will likely be a record or near-record warm 2023 will only be part of the story, but it will definitely contribute.
AMO
If you detrend HADCRUT4 and place it over AMO, the match is remarkable
https://twitter.com/WHUT/status/1705450498030027170
Mistake in 1st phrase, it should be 2024
Mistake in 1st phrase, it should be 2024
Wrong date!
Thanks for flagging this. I caught this in the article teaser, but missed it here. Tom is apparently reluctant to acknowledge the year is drawing to a close.
Long Tearm forecast / guess please?
I understand that I am asking for a SWAG, but is it "likely that we will have another winter similar to 22-23?
Dan
winter 2023-24
The likelihood that this coming winter resembles last winter depends on where you live, but I would say that it is unlikely that we will have a winter like last year in the U.S. (and many other global locations) overall. Last winter we were experiencing La Nina conditions, and as Tom reviewed last year, the U.S. climate anomalies resembled the expected La Nina impacts in many ways. This winter we are expecting El Nino conditions, and so most of the expected impacts are the reverse of that of La Nina. We also know that other less predictable factors will shape the coming winter, and there's no reason to expect that those more random factors will be the same as last year.
So, stay tuned to CPC's seasonal outlooks, and check back in November when we have our annual Winter Outlook blog post.
September 2023 ENSO Outlook: An El Niño convo
Brilliant. Hilarious. Informative. Spot on. Please produce more of this brand of interview.
Agreed! I love this post. :-…
Agreed! I love this post. :-)
Agree!
Me too. Nerd out but have fun!
Nino
Strong only in the technical sense. I believe we follow modaki el nino pattern. Drawing comparisons from 2010 and 92' el ninos
El Nino
This looks like a stronger East based El Nino and not a modoki to me with the warmest temperatures in the Nino 3 and Nino 1.2 regions
Modoki
I agree with Bob that this event is not evolving like a typical Modoki event, as the sea surface temperature anomalies have been strongest in the eastern Pacific and gradually expanding westward. However, I do think there is an important kernel of truth in this comment, in that the strength of this event based on the Nino-3.4 index alone could given an impression that this event is stronger than it actually is, given that the global oceans outside of the tropical Pacific are also very warm. This could make it more challenging for rainfall anomalies to develop in the eastern Pacific like in other strong El Nino events (though this hasn't been an issue so far). I hate to plug my own paper, but the presence or absence of convection in the eastern Pacific could help to shape the large-scale climate pattern that develops this winter.
Zeus and Poseidon respond
I could have simply written that this was an informative and highly entertaining post, but Tom's creative writing gave me an idea for how to do this:
Zeus: Well, tropical atmosphere, I don't remember giving you permission to have an interview with that NOAA blogger. And, Pacific Ocean, I don't think Poseidon authorized you to have that interview.
Tropical atmosphere: My apologies, lord of the skies. I'm a huge fan of the ENSO Blog, since they are so interested in me, and I just couldn't resist when Tom invited me on. I will be more careful about accepting interview requests going forward.
Pacific Ocean: I am also sorry, ruler of the skies, and please let the king of the seas know that I apologize. But, the meteorologists with ENSO Blog treat me like a huge celebrity, and just seem to want to get to know me better! I mean, everyone else just seems to want to fly over me, travel over me, and catch fish in me, which makes me feel kind of lonely and used. So, it's really nice when some people just seem interested in getting to know me better as an ocean, and I was honored when Tom asked to interview me. And, when he did, I tried to act professionally and to remember whom I was representing.
Zeus: It's honestly fine. You both did a very good job, and everyone on Mt. Olympus is proud of you. So, tropical atmosphere, feel free to give as many interviews as you want.
Poseidon: Once again, Pacific Ocean, nicely done. You can give as many interviews as you want, going forward.
Tropical atmosphere: Thanks! And, I will do my best.
Pacific Ocean: Thank you, and I will remember whom I am representing.
Well done! :-)
Well done! :-)
Ditto!
Indeed!
El Nino and the Polar Vortex
How will El Nino affect the Polar Vortex this Fall and Winter ?
El Nino and the Polar Vortex
Guest author Dr. Amy Butler wrote about this topic several years ago. As you can see from her post, there is an increase in probability of a weaker polar vortex and a late winter sudden stratospheric warming during El Nino, though the impacts tend to be stronger in Europe and Asia than in North America.
QBO
Also more to do with the QBO state
PV and nino
https://www.severe-weather.eu/global-weather/early-polar-vortex-disrupt…-
Hi Rebecca Thanks a lots…
Hi Rebecca
Thanks a lots for the information . Rich and informative like always . What are the odds this autumn and incoming winter would be a modoki elnino. coming across many re-analyses and published work , the years 2022-2023 and 2024 are nominated frequently as possible Modoki elninos.
Thanks a lots .
Mohammad Alkhateeb
Irbid city , The North Bride of Jordan.
Modoki
As I responded above, this event is not evolving like a typical Modoki event, as the sea surface temperature anomalies have been strongest in the eastern Pacific and gradually expanding westward. However, the global ocean warmth this year could make it more challenging for rainfall anomalies to develop in the eastern Pacific like in other strong El Nino events (though this hasn't been an issue so far). If that were to happen, then the tropical rainfall anomalies could look more like a Modoki event. However, given how warm and wet the eastern tropical Pacific is right now, I'm not expecting this to be the case at this time, but it's something to keep an eye on.
Paper
Thanks for the link Nathaniel! I read part of it. I would like to read the entire document but I don't know if the $39.95 payment is in the budget for me right now.
Yeah, I definitely would not…
Yeah, I definitely would not pay that price out of pocket! I should look into seeing if I can post the article somewhere that's freely accessible. In the meantime, feel free to email me (address easily found on my web page), and I can send it to you.
Paper
Thanks Nathaniel
I emailed you today
Thanks
Thank you .
Not to Confident
that this El Nino event will fully impact this Winter here in the Ohio Valley and Kentucky ?
Ohio Valley/Kentucky
It's a bit too early to tell, as this region does not have the strongest connection to El Nino relative to some other regions in the U.S. You can check CPC's seasonal outlook updates as well as some of the dynamical model guidance, like from the NMME. Some of the NMME models have been suggesting a relatively cool winter around that region (especially compared with last winter), which does happen in some El Nino winters, but not all models agree on this.
Enjoyed It
Love the way blog was written considering the gravity of the planetary situation. Chuckles never hurt. Clever and informative. Fun. Back to my ossilating. HM
El nino
What does that mean for Chicago
El Nino and Chicago
Unfortunately, El Nino, on average, does not have a strong influence on weather in Chicago. It tends to be warmer-than-average to the north and cooler-than-average to the south during winter, so Chicago is in between the two temperature signals. El Nino does bring a slight tendency for drier-than-average winters in the region. Please feel free to check CPC's seasonal outlooks to see how they expect conditions to evolve over Chicago.
El Nino 2023/2024 impact on Pacific Northwest
Winter 2022/23 seemed particularly colder in southwestern idaho. Any prognostications of el Nino 2023/24 impact this season in Idaho?
El Nino and Idaho
CPC's current seasonal outlooks are pretty consistent with typical El Nino impacts over Idaho: elevated chance of below-normal precipitation and above-average temperatures this winter. So, there is a pretty good chance (but no guarantee) that this winter will not be as cold as last winter for this region.
Questions on the Two Types of El Nino Events
The two types of El Nino events the ' Cold Tongue ' and the ' Warm Pool. ' I know it's early, but which El Nino does NOAA think will happen this Winter ? We had quite an impact here in Kentucky with the very strong El Nino 2015 - 16. Which of the two was that ? Does NOAA have that information on record ?
Thank you in advance,
Stephen S.
El Nino Type
The NOAA Climate Prediction Center does not monitor or forecast the particular El Nino type (e.g., Warm Pool/Central Pacific versus Cold Tongue/Eastern Pacific). I cannot speak for CPC, but I believe there are several reasons why. First, there are no universally accepted definitions for the two types of El Nino. Second, the type of El Nino is closely related to the strength (as discussed in this blog post), with weaker events typically resembling the Warm Pool/Central Pacific type and stronger events resembling the Cold Tongue/Eastern Pacific type. So, CPC's new ENSO Strength outlook provides some indication of El Nino type. The 70-75% chance that the Nino-3.4 index will exceed 1.5C provides a hint that the Cold Tongue/Eastern Pacific type may be favored.
With all that said, I recognize that there is still El Nino pattern variability even when we control for strength (e.g., the 2015/16 event was centered more toward the central Pacific than 1997/98 even though 2015/16 was one of the strongest events). This event has been warmest in the eastern Pacific, with the warmth gradually expanding westward, so that's another reason that this event may be centered farther east than most other recent El Nino events.
Nino 3.4 index
Dear friends,
Where can I monitor the temperature of the Nino 3.4? I follow it daily on the website tropicaltidbits.com and I haven't seen a day reach a value of 1.6º
Nino 3.4 SST
You can find the weekly (OISST), monthly (OISST and ERSST), and seasonal (ERSST) Nino region sea surface temperature data that NOAA monitors at this website. Specifically, the weekly OISST can be found here (latest weekly Nino 3.4 index of 1.6C). NOAA CPC does not regularly monitor daily Nino 3.4 sea surface temperature data.
Keep in mind that the daily Nino 3.4 values that you find on Tropical Tidbits are based on CDAS Reanalysis, which is a product that combines observations with a climate model to fill in data gaps. The values from this reanalysis do not and are not expected to match up exactly with the official sea surface temperature data that NOAA monitors. The daily CDAS time series still can be a useful indicator of recent changes in the Nino 3.4 index, but as you can see, there can be substantial offsets between the values you see there and what is seen in the more purely observation-based OISST and ERSST products (but even those products can have substantial differences at times).
Daily OISSTv2 Nino indices
Hey Bernardo. Here's a link to daily and 15 day running avg Nino indices based on the same OISSTv2 dataset used by the NOAA CPC to monitor weekly and monthly SSTs in the Nino regions. The plots are similar to the Tropicaltidbits CDAS Nino indices. Click on the "OISST" box near the top of the page and then scroll to the bottom for the SST anomaly plots. Nino indices based on the Coral Reef Watch (CRW) dataset are also available. Daily values can be quite noisy/volatile. However, as Nat mentioned, can be useful in monitoring recent chages.
https://cyclonicwx.com/sst/
NOTE: OISSTv2 data are not used for NOAA's official Ocean Nino Index (ONI). The ONI is based on monthly ERSSTv5 data with centered base periods, which can run a little cooler than OISSTv2 data.
Thank you, Ben!
Thank you, Ben!
I forgot to say thank you to…
I forgot to say thank you to the NOAA ENSO blog team! I look forward to these posts every month. Keep up the great work!
El NINO IN ARIZONA
El Nino or no El Nino--come to Arizona for the winter--warm and sunny--bring money! If it rains more than 2 days in a row you get your money back!
Sailing across the Pacific
Loved the Pacific Ocean and Tropical Atmosphere bits!! Thanks!
In June 2003 I sailed from Panama to the Marquesas during what I now see was essentially a "neutral" period, right after an El Nino. We had a great trip with really nice tradewinds.
Now I am getting ready to make that trip again in early '24 - but I see generic effects of El Nino are weaker tradewinds on that route, or even headwinds. That would be bad, it's a long way on a small boat.
I know it's very specific, but how can I or should I connect the emerging El Nino data with the likelihood of good tradewinds for the trip. I could just wait until early '25.....
Over the past several months…
Over the past several months the trade winds have weakened in the east-central equatorial Pacific... this will likely continue through the course of the event which is favored to last at least through the Northern Hemisphere winter (March/April). Sorry for the bad sailing news!
Effects of El Nino in the coast of Ecuador
Hi!
Thanks for the info! We have very limited information in South America about these matters... Is there a way to predict if rainfall in the coast of Ecuador will be very strong? The precipitations El Niño of 82-83 and 97-98 were devastating, but in the 15-16 event they weren't that bad... I'd appreciate any info you. could share.
Thanks again!
There are two ENSO…
There are two ENSO prediction groups I'm aware of in Ecuador and Peru, who are also keeping tabs on potential implications in the local region.
One is ENFEN (Peru) which you can find here:
https://www.gob.pe/institucion/imarpe/noticias/834776-comunicado-oficial-enfen-n-14-2023-estado-del-sistema-de-alerta-alerta-de-el-nino-costero
And CIIFEN (Ecuador): https://ciifen.org/el-nino-la-nina-ciifen/
I know both are monitoring closely the potential impacts, especially as we get into March-May 2024. We will see if the far eastern Pacific/ coastal SSTs remain above average as we get into those seasons. It is a much trickier and challenging prediction than predicting Nino3.4 which we focus on!
Image Key
Hi, on the bottom of the sea surface image of the global temperature differences from the averages, should the scale should say .9 degrees F difference negative or positive? Thanks
Comments have been disabled on this article