How do NOAA scientists predict the annual global temperature ranking ahead of time?
This is a guest post by Karin Gleason, who is the monitoring section chief at NOAA Centers for Environmental Information (NCEI) in Asheville, NC.
The warmest year on record for the globe occurred in 2016, following a strong El Niño (2015-16). Since then, conditions in the central-eastern tropical Pacific have largely been on the cooler side, with one weak El Niño winter (2018-19), a double-dip (2017-2018) and a triple-dip La Niña (2021-2023), and one ENSO-neutral winter in between (2019-20). Recently, in June 2023, an El Niño Advisory was issued, with a 56% chance for a strong El Niño to develop this coming winter.
So, the question everyone is asking is what does that mean for global surface temperatures? Could a strong El Niño in the coming fall and winter be enough to push global temperatures to a new record high this year (2023)? Or will new heights in global temperatures wait until 2024? Is it possible (or plausible) that 2023 and 2024 will continue to be among the warmest 10 years on record, but not challenge 2016 for top billing?
Before we get into what 2023 and 2024 global temperatures might do, let’s have a little review on what we do know about global temperature behavior during years with El Niño or La Niña. We know that La Niña tends to have a cooling effect on global temperatures, whereas El Niño has a warming effect. But we also know the biggest change in NOAA’s global temperature anomaly time series (shown above) is an overall increasing trend in temperatures, especially since the late 1970s. This warming trend, caused by global warming due to human-produced greenhouse gases, is temporarily enhanced during El Niño and somewhat suppressed during La Niña.
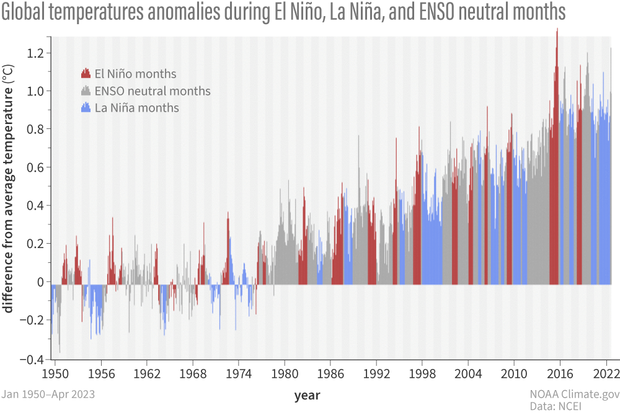
Monthly global surface temperature for January 1950–May 2023 compared to the 20th-century average, colored by monthly ENSO values. Recent decades are mostly warmer than earlier decades due to human-caused global warming. But compared to other months and years in the same decade, El Niño periods (red bars) tend to be warmer than La Niña periods (blue bars) in part because the tropical Pacific—a very large area of Earth’s surface —is well above average during El Niño. NOAA NCEI image.
As the world’s biggest ocean, the Pacific has a strong influence on global average temperature. However, several top ten records have been recorded over the last three years, despite being mostly in La Niña (footnote #2): the second warmest (2020), and the tied-for-sixth-warmest (2021, 2022) on record (footnote #3). The underlying warming trend also makes it possible for ENSO-neutral years to achieve record to near-record levels, which can also be seen in prior years (footnote #4).
On-board diagnostics
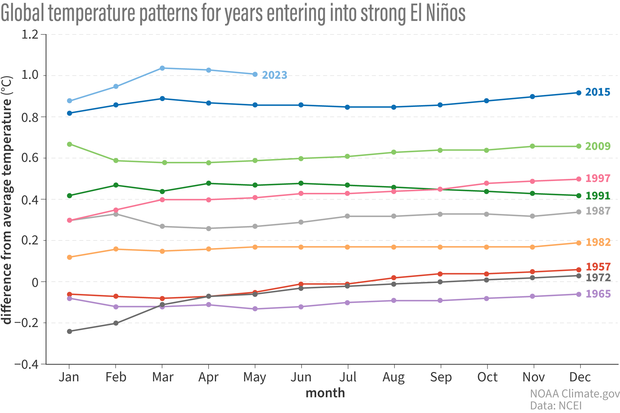
Difference from average temperature for the year to date (by month) for 2023 (top line, light blue) and all other years where a strong El Niño developed in the second half of the year. During all past years except 1991, the year-to-date temperature anomaly in mid-year held steady or increased as the year progressed. Based on that pattern, the final 2023 average anomaly is unlikely to be smaller than the year-to-date as of May. On that trajectory, 2023 would eventually tie 2020 for second-warmest year on record. NOAA NCEI image.
Historically, how have globally averaged temperature anomalies behaved leading up to a strong El Niño? In the plot above, only years preceding a strong El Niño are shown (footnote #5). In eight of the nine years, global anomalies generally remained steady or increased as they approached the end of the calendar year. That pattern suggests that the annual 2023 anomaly is likely to be at least as large as the year-to-date anomaly as of May.
Based on the latest data from NOAAGlobalTemp, the January through May 2023 global year-to-date temperature anomaly is 1.01°C above the 20th-century mean. That’s 0.20°C below the 2016 record for the same period, with 2020 and 2019 hovering in between 2023 and 2016. But unlike the pattern common to years with developing El Niño events, each of those other three years saw their year-to-date anomaly values get smaller as the year progressed.
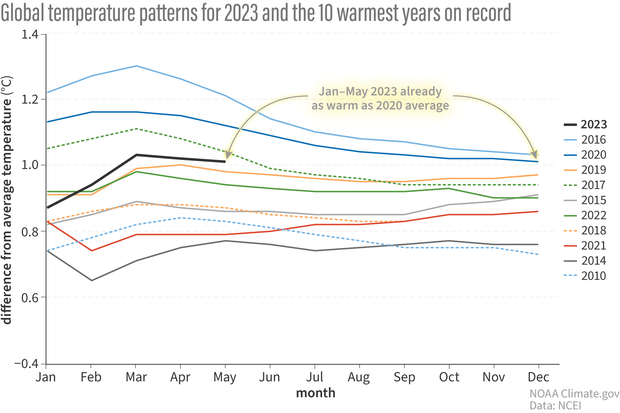
Global year-to-date temperature anomalies by month for the 10 warmest years on record and 2023 year-to-date values through May. May 2023’s year-to-date temperature anomaly ranks fourth highest among the 10 warmest years, but it is roughly as large as the annual 2020 anomaly. 2020 was the second-warmest year on record. NOAA Climate.gov image, adapted from original by NOAA NCEI.
Anecdotally, this could mean that if this year behaves like other years that saw El Niño develop, and the global temperature anomaly does not decrease as the rest of the year plays out, 2023 could tie with 2020 for the second-warmest year on record. If we want to be more precise about the odds of 2023 ultimately setting a new temperature record, we need to do a more robust statistical analysis, which is explained further in the next section. But, based on recent history and this anecdotal analysis of these 9 strong El Niño years, it is likely that 2023 will be one of the warmest years on record.
Under the hood
Back in 2015, when we were on the verge of a strong El Niño, my colleagues developed a statistical forecast for how globally averaged temperature anomalies might rank. Since the time of that blog post, NCEI developed and formalized a global temperature rankings outlook tool that is updated each month, concurrent with the release of the monthly global climate report. This tool provides probabilities, or the percent chance, that a particular year will have a certain ranking.
As you would expect, the range of possible ranks for any given year is wider toward the beginning of the year and then narrows as we get closer to the end of the calendar year, when we already have observations from the previous months. And to be super clear again, this tool does not utilize weather or climate forecast models (or ENSO) to determine the potential range in future temperature ranks.
It looks at how different recent annually-averaged temperature anomalies are versus all the previous anomalies. Is this year trending hotter than those years? Cooler? Around the middle? Then it compares how similar or different recent values are from month-to-month values in past years to form a statistical distribution (footnote #6).
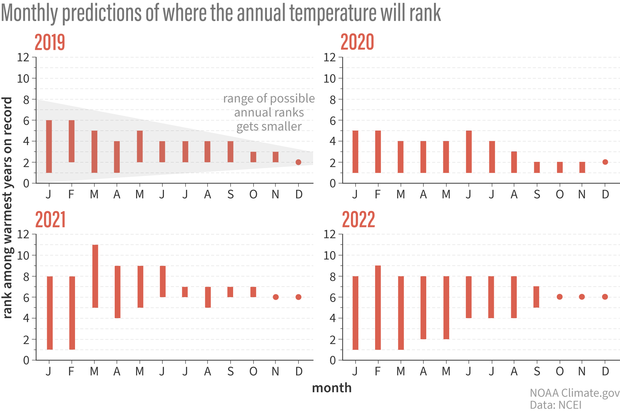
Predicted rank for global temperature by month for 2019-2022. At the start of each year, more possibilities for the eventual rank exist (taller bars indicating wider possible ranges). Because there is a limit to how much the global temperature anomaly can vary from from to month, the range of possible ranks narrows as the year progresses. In 2022, the predicted rank didn't change after September. Climate.gov image, adapted from NOAA NCEI.
The analysis then compares this information with observations since 1975 to estimate month-to-month differences that are likely similar to what we are observing in real-time. (footnote #7). This distribution is important as it gives a realistic look at how anomalies change month-to-month. Because, remember, we don’t know exactly how this year’s anomalies will change month-to-month. The tool then runs 10,000 simulations of this year’s monthly anomalies to create a range of statistically plausible outcomes. From this range, the ranking probabilities are determined (footnote #8).
For 2023, and through the month of May, NCEI’s rankings tool indicates that it is likely for 2023 to end the year with a ranking of at least 7th warmest. This same tool indicates there is a ~12% chance of this year becoming the warmest on record ever. There is also a 92% chance 2023 will be among the 6 warmest years and nearly a 50% chance of a top 3 year. This is a narrower window in rank range as compared with January’s likely range of 1st to 10th warmest (footnote #9.)
An additional point to note is that, at this time, the probability method does not account for statistical relationships between El Niño or La Niña indices and global temperatures, and is something NCEI is considering for future development work. One of the findings this tool has revealed is that since 1988, there has been a strong propensity for recent years to be initially ranked as a top-10 warm year. This is a direct result of the increasing temperature trend that is present in the historical dataset and is influencing many of the changes we are observing in our climate system.
Future maintenance
So, what might that mean for 2024 global temperatures? A lot depends on how strong this evolving El Niño event becomes and for how long it endures. Marine heat waves, volcanic eruptions and many other variables could also have an impact, one way or another, on 2024 global temperatures. If this El Niño continues into 2024, it is quite possible that 2024 could be warmer than 2023. El Niño events that span calendar years do favor having a warmer year in the second year of the event. So, if you are still reading this post, you probably should bookmark NCEI’s global annual temperature rankings tool outlook supplemental page and check in each month for the latest.
Lead Editor: Tom Di Liberto (NOAA)
Footnotes
- Informally, “Strong” El Niño is defined as a period of time where the running 3-month mean sea surface temperature anomaly averaged over the Niño-3.4 region (in the eastern tropical Pacific Ocean) is at or above 1.5°C, as determined by the Oceanic Niño Index (ONI).
- Late 2019 and early 2020 were ENSO-neutral following a weak El Niño in winter 2018-19. A La Niña formed in July-September of 2020, marking the start of three back-to-back La Niña winters, with cooler Pacific conditions prominent throughout 2021 and 2022. Based on tropical Pacific conditions, La Niña ended in December-February 2023.
- Rankings at the end of each year using the NOAAGlobalTempv5.0 dataset. In January 2023, NCEI updated its operational version of NOAAGlobalTemp to v5.0.1. Current global temperature anomalies and ranks do vary slightly from the previous version.
- ENSO-neutral years that produced record to near-record monthly global temperature anomaly values, that follow an overall warming trend, can be seen in the first figure and include: 1979, 1981, 1990, 1991, 2002, 2017, 2020, and 2022.
- First year of strong El Niño events identified: 1957, 1965, 1972, 1982, 1987, 1991, 1997, 2009, 2015.
- What do we mean by statistical distribution? Think of this like the range of temperatures observed on a given day at a particular location. The most likely temperature, based on historic observations, is near the climatological average, with the chances of higher or lower temperatures getting smaller the farther away from that average you go. In this case, there is a most likely number for how much the anomalies differ from month to month, with the chances of other month-to-month differences decreasing the farther away from that number you go. If you’ve heard of a bell curve, this is what is being described.
- The 1975 to present time period is utilized as a 40+ year comparative record baseline for estimating monthly variations that are likely representative of what we might see in the present time.
- In this Monte Carlo uncertainty analysis, an ordinary least squares trend is removed and plausible outcomes are simulated based on autoregressive modeling of the residual time series. Lastly, the trend is added back to account for simulated months, compute annual averages, and compare them to all prior annual averages since 1850 to arrive at annual rankings. The skillfulness of this tool is due to the robust statistical analysis (10,000 simulations) performed on a lengthy historical record (174 years and counting). There are many month-to-month observations that behave within certain ranges and the statistical model picks up on these patterns to determine the most likely outcomes.
- Looking at the years from 2019 to 2022 when this tool has been applied in real time, we see that rankings narrow and settle by late summer into early fall and overall, capture the eventual end-of-year ranking.
References
Sánchez-Lugo, A., C. Morice, P. Berrisford, and A. Argüez, 2018: [Global Climate] Global Surface Temperatures [in "State of the Climate in 2017"]. Bull. Amer. Meteor. Soc., 99, S11-S13.
Somewhat. Very. Extremely. How likely is it that 2015 will be the new warmest year on record?
Comments
Share your questions and thoughts with us!
Please remember...
Translate 2023-24 winter outlook
For the general public, can you just give an easy to understand winter outlook for the USA? I live in Harrison Arkansas and the forecasts for the middle States are very lacking on details and like reading a foreign language.
? is it going to be warmer or colder, less snow, freezing rain, or more than the past year?
Just need an easy to read forecast.
Lisa Gibson
Here you go! Seasonal…
Here you go! Seasonal average outlooks for temp and precip for the coming year: https://www.cpc.ncep.noaa.gov/products/predictions/long_range/
Global temperature
It's fascinating to learn about the methods NOAA scientists use to predict the annual global temperature ranking. The statistical analysis and tool developed by NCEI provide valuable insights into how different years compare to historical temperature anomalies. The fact that there is a 92% chance of 2023 being among the 6 warmest years and a 12% chance of it becoming the warmest on record is significant. The influence of El Niño and La Niña events, as well as other variables like marine heat waves and volcanic eruptions, add complexity to the predictions for 2024. I appreciate the transparency in explaining the limitations of the current method and the ongoing development work to incorporate statistical relationships with El Niño and La Niña indices. It's crucial to continue monitoring global temperatures closely and utilizing tools like the NCEI's global annual temperature rankings outlook to assess the impact of climate change on our planet. (Impact of Space Weather on Earth)
Comments have been disabled on this article