El Niño and the stratospheric polar vortex
This is a guest post by Dr. Amy Butler (@DrAHButler) who is a research scientist at the University of Colorado Cooperative Institute for Research in Environmental Sciences (CIRES) and sits within the NOAA Chemical Sciences Division (CSD). Her research focuses on large-scale climate patterns and phenomenon, such as the Arctic and Antarctic Oscillations and sudden stratospheric warmings.
“’Polar vortex’ set to strike the U.S. as snowstorm death toll rises” (Slate). “Polar vortex transforms Mid-Atlantic to Mid-Antarctic” (Washington Post). “Economic impact of ‘polar vortex’ could reach $5B” (CBS News). These are all real headlines from 2014 and 2015, when the phrase “polar vortex” first appeared in public lexicon.
These words might evoke images of a giant spinning tornado of cold air wiping out everything in its path. However, the “polar vortex” historically describes the strong westerly winds that zoom around the northern pole in the stratosphere every winter (Waugh et al 2016) (footnote 1).
The stratosphere is the layer of the atmosphere between about 6 and 30 miles above the Earth’s surface. El Niño operates in the troposphere, the layer of the atmosphere closest to Earth’s surface. So how can El Niño be connected to the polar vortex, and why should we care?
Cold air outbreaks and the stratospheric polar vortex
The stratospheric polar vortex weakens when large-scale atmospheric waves (e.g., 800 miles across) from the lower atmosphere travel up into the winter stratosphere. When these waves break—yes, even atmospheric waves break—the polar vortex can rapidly decelerate and even reverse direction completely.
When the vortex breaks down, there is an event called a major “sudden stratospheric warming” (SSW). The “warming” refers to the dramatic increase in temperature (~50-70 degrees F in a few days!) over the polar stratosphere during these events (see the figure below). These events occur roughly every other year in the Northern Hemisphere.
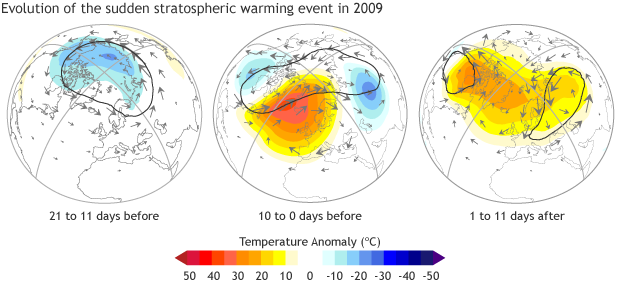
The evolution of a polar vortex collapse in January 2009. (left) Prior to the event, stratospheric winds (gray arrows) circle counterclockwise, from west to east, around the pole. The vortex (solid black line) is nearly circular, and the temperatures at 10 hPa (roughly 31 km in altitude) are cooler than usual. (middle) As the waves from below break in the stratosphere, the vortex elongates and wobbles (like a spinning top that you nudge). Temperatures warm rapidly. (right) The vortex splits into two pieces, and the winds near the pole reverse direction. Note: For simplicity, only winds north of 30° are shown. NOAA Climate.gov image adapted from Butler et al. (2015).
These rapid decelerations of the stratospheric polar vortex can sometimes affect the circulation all the way to the surface and lead to changes in surface temperatures for days to weeks afterwards (Baldwin and Dunkerton 2001; see figure below). In particular, there is an increased likelihood of cold, Arctic air spilling into the mid-latitudes (where most people live) (footnote 2). Thus, these intrusions of cold air actually occur when the stratospheric polar vortex weakens or completely dissipates, not when the vortex strengthens.
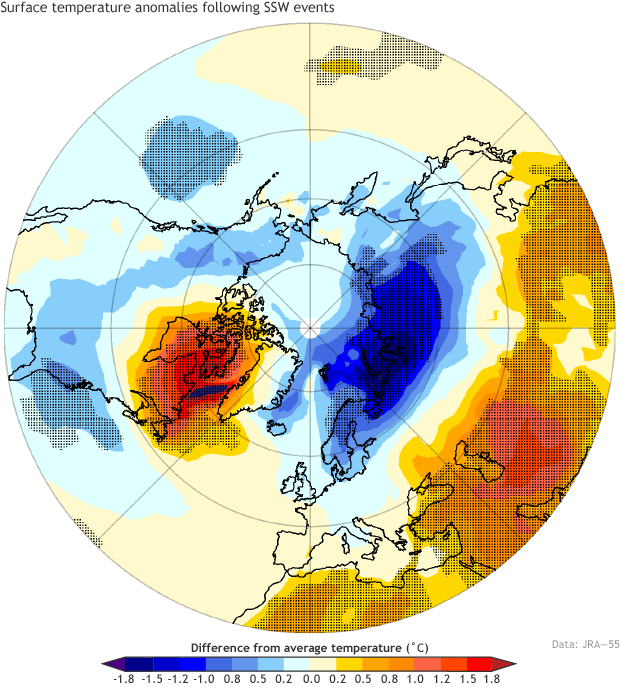
Average surface temperature anomalies for 60 days following 35 vortex breakdown events (using JRA-55 reanalysis). Gray shading indicates anomalies greater than 2 standard deviations, indicating a statistically robust deviation from average. The breakdown of the polar vortex produces long-lasting temperature anomalies. Greenland and northeastern Canada become unusually warm, while Europe and Asia become unusually cold. Adapted from Butler et al (2014).
It is important to note that many intrusions of cold Arctic air, including the ones described in the headlines above, are largely unrelated to the stratospheric polar vortex, and are instead due to normal meanders of the tropospheric jet stream (footnote 3).
But understanding and predicting break downs of the stratospheric polar vortex is a potentially important opportunity for improving seasonal forecasting skill, because of the intra-seasonal to seasonal persistence of its effects on surface weather. In other words, if we had more advance warning that the polar vortex were going to weaken, it’s possible we could forecast winter temperatures more accurately farther in advance.
Because the periodic breakdowns of the polar vortex are driven by the same waves that drive tropospheric weather patterns, they generally cannot be predicted by weather models more than 10-15 days in advance. So in terms of forecasting, they may provide additional skill if your model forecast is created while an event is happening (Sigmond et al 2013); but what if you’re making a seasonal forecast (i.e., predicting 3 months in advance)? Here’s where El Niño comes in.
Perfectly placed wave trains
ENSO influences climate all over the world by generating planetary-scale “wave trains” (footnote 4) that shift the jet stream and associated weather patterns. During El Niño winters (footnote 5), these wave trains may occur more often in an ideal location (footnote 6) to strengthen into the stratosphere, causing a weaker stratospheric polar vortex in late winter and more frequent major disruptions of the polar vortex (e.g., García-Herrera et al 2006; Garfinkel and Hartmann 2007; Cagnazzo and Manzini 2009; Fletcher and Kushner 2011; Butler and Polvani 2011).
While ENSO’s influence on North American wintertime climate is directly tied to these wave trains, the wintertime climate over Europe and Asia is dominated instead by the occurrence of the polar vortex breakdown (or lack thereof) no matter the phase of ENSO (Ineson and Scaife 2009; Butler et al 2014; Richter et al 2015; see figure below). So, if a forecast model were able to simulate the enhanced probability of polar vortex breakdowns during El Niño and the subsequent impacts on surface climate (which can be a big “if”! (7)), we might see enhanced seasonal predictive skill for wintertime climate over the North Atlantic/Eurasian regions (8) (Domeisen et al 2015; Scaife et al 2016).
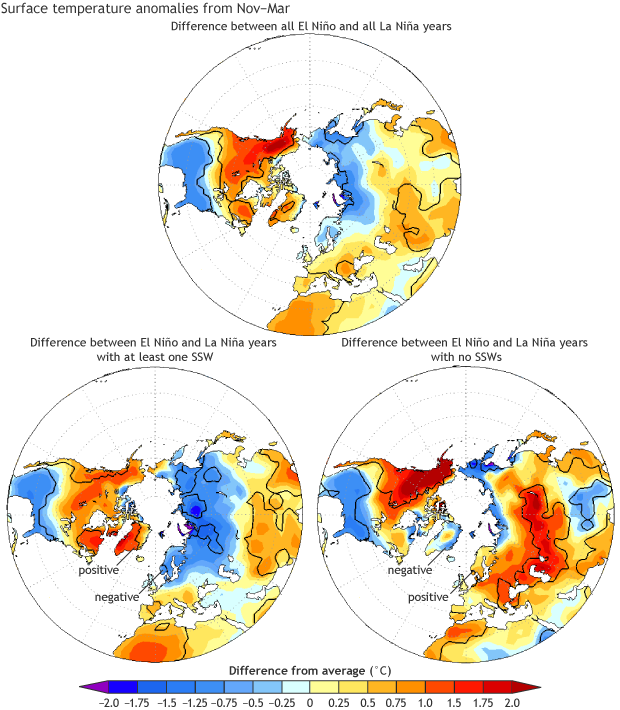
How sudden stratospheric warming (SSW) events modify El Niño’s impacts on winter climate. (left). Difference in winter (November-March) temperature anomalies between (left) all El Niño winters and all La Niña winters. (middle) between El Niño and La Niña winters with at least one SSW, and (right) between El Niño and La Niña winters with no SSWs. The warm temperature anomalies over North America remain similar regardless of SSW events, but the temperature anomalies over Europe, Asia, and Greenland are either negative or positive depending on the occurrence of an SSW. Solid black contour indicates statistically significant anomalies. From Butler et al. (2014).
How did the polar vortex behave during the big El Niño winter of 2015-2016?
The average response of the stratospheric polar vortex to past El Niños is weakening of the vortex in late winter and an increased chance of polar vortex breakdowns (i.e., SSWs) (9). This is generally what we saw this past winter, except that during early winter from November to mid-January the vortex was extraordinarily strong (see figure below). The strong vortex may have contributed to the hemispheric-wide warmth we saw in early winter (fewer cold air outbreaks!).
However, in February, planetary-scale waves propagated upward and began to pummel the vortex, leading to a breakdown of the polar vortex on March 5, 2016. This breakdown of the vortex was so strong that it is the earliest final breakup on record (the vortex will not return until next winter).
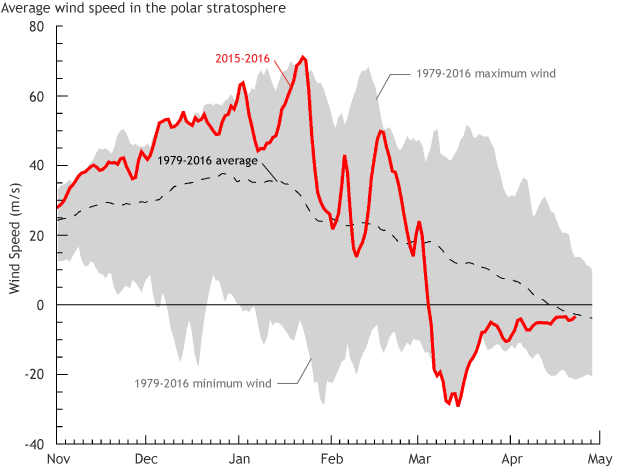
Daily zonal (west-to-east) winds [meters/second] in the polar stratosphere at 10 hPa (about 31 kilometers altitude) and 60°N. The grey shading shows the range of natural variability from 1979-2016. The black dashed line shows the daily average. The red line shows the daily zonal winds for 2015-2016. Data is from NCEP-NCAR reanalysis.
The circulation in the stratosphere has influenced the surface occasionally since the event (see the figure below), and may have contributed to recent record warmth over Greenland as well as a persistence of winter-like weather into spring for some mid-latitude regions.
Nevertheless, the seasonal climate impacts of final warmings are still somewhat uncertain. Overall the impacts of this event may be less than if the same event occurred two months ago during the height of winter, because its impacts are felt more prominently against a colder starting condition.
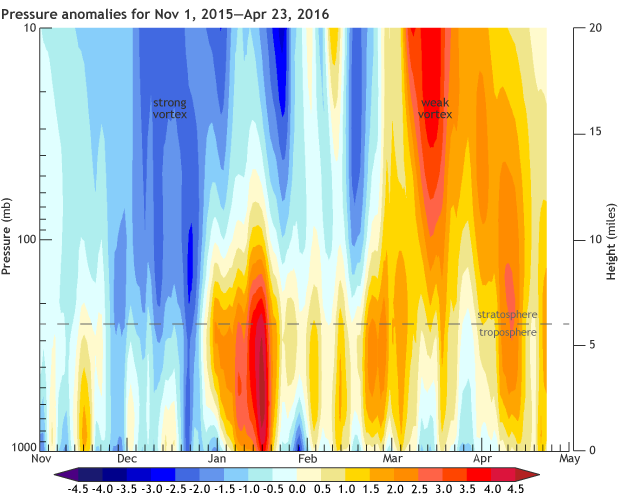
65-90°N geopotential height anomalies (standardized by the JFM mean/standard deviation) for Nov 1 2015 - April 12 2016. Geopotential height is the height above the surface at which you find a given level of air pressure. A positive anomaly means the pressure is unusually high for a given altitude, which is generally linked to warmer than usual conditions. Negative anomalies mean lower pressure and colder air. In early winter, the vortex was anomalously strong (blue shading); in Jan/Feb, the stratosphere was largely decoupled from the troposphere; and in late winter, the vortex was anomalously weak (red shading) following a final major SSW on March 5.
The bottom line is that El Niño, with its modified planetary waves, tends to promote the breakdown of the polar vortex, especially in late winter, which in turn modifies the atmospheric circulation pattern associated with the El Niño. This additional stratospheric influence on wintertime climate is major for Asia, Europe and Greenland, but is more subtle for North America. Nonetheless, it represents yet another phenomenon that could improve sub-seasonal and seasonal climate forecasts if models could capture its effects effectively.
Lead reviewer: Anthony Barnston
Footnotes
(1) There is also a stratospheric polar vortex in the Southern Hemisphere, where the winds circle clockwise around the southern pole during austral winter and spring. The strength and timing of the breakup of the Southern Hemisphere polar vortex in spring plays a major role in the annual ozone hole.
(2) This shift brings cold Arctic air into mid-latitude regions like the eastern United States, northern Europe and Asia. We also see warmer temperatures over Greenland and southern Eurasia. We see roughly opposite-signed temperature anomalies when the polar vortex is very strong. The changes are strongest over the North Atlantic-Eurasian region, and the pattern looks like the negative phase of the North Atlantic Oscillation or Arctic Oscillation.
(3) The stratospheric polar vortex is often linked (or coupled) to the tropospheric polar jet stream in wintertime, but not always—sometimes they do their own thing and there is little to no relationship between them. But when they are coupled, and the polar vortex weakens or breaks down, it causes the tropospheric polar jet stream to meander southward.
(4) In many ways, the atmosphere behaves like a fluid. It flows. It eddies. It also spawns massive waves. Planetary waves, which may show up as broad ups and downs in the flow of a jet stream, are very long waves, with 1,000 or more miles between a crest and an adjacent trough. We call them “wave trains” because the structure may consist of several peaks and troughs, making it looks like the cars of a train. Planetary wave trains may not move forward or backward, but remain approximately stationary, and when that is the case the waves in the train are known as stationary waves. During El Niño, a stationary wave train may stretch all the way from the subtropical Pacific into Canada, forming a broad right-curving arc.
(5) La Niña winters show a less robust relationship with SSWs. Most models indicate fewer SSWs during La Nina, while observations show more SSWs occurring during La Nina winters (Butler and Polvani 2011). However, that result appears to be quite sensitive to the dataset used and the threshold chosen to define La Nina events.
(6) In particular, the geopotential heights are anomalously low over the North Pacific. This encourages constructive linear interference with the climatological wave pattern (Fletcher and Kushner 2011). This means that the negative departure from the average geopotential height in the North Pacific during an El Niño adds to the already normally relatively lower heights in that location.
(7) Many models still do not simulate stratospheric processes or their linkages to the surface well.
(8) Of course, this relationship and its potential implications for improved subseasonal to seasonal forecast skill is complicated by the fact that ENSO is merely one factor that can affect the stratosphere. For example, Eurasian snow cover, Arctic sea ice, the 11-year solar cycle, the Quasi-Biennial Oscillation, and the Madden-Julian Oscillation have all been shown to potentially influence the stratospheric polar vortex.
(9) Note that this is not a perfect relationship. For example, there were no major SSWs during the last big El Niño winter 1997-98.
References
Baldwin MP, Dunkerton TJ (2001) Stratospheric Harbingers of Anomalous Weather Regimes. Science (80- ) 294:581–584. doi: 10.1126/science.1063315
Butler AH, Polvani LM (2011) El Niño, La Niña, and stratospheric sudden warmings: A reevaluation in light of the observational record. Geophys Res Lett. doi: 10.1029/2011GL048084
Butler AH, Polvani LM, Deser C (2014) Separating the stratospheric and tropospheric pathways of El Niño–Southern Oscillation teleconnections. Environ Res Lett 9:024014.
Cagnazzo C, Manzini E (2009) Impact of the Stratosphere on the Winter Tropospheric Teleconnections between ENSO and the North Atlantic and European Region. J Clim 22:1223–1238. doi: 10.1175/2008JCLI2549.1
Domeisen DI V., Butler AH, Fröhlich K, et al (2015) Seasonal Predictability over Europe Arising from El Niño and Stratospheric Variability in the MPI-ESM Seasonal Prediction System. J Clim 28:256–271. doi: 10.1175/JCLI-D-14-00207.1
Fletcher CG, Kushner PJ (2011) The Role of Linear Interference in the Annular Mode Response to Tropical SST Forcing. J Clim 24:778–794. doi: 10.1175/2010JCLI3735.1
García-Herrera R, Calvo N, Garcia RR, Giorgetta M a. (2006) Propagation of ENSO temperature signals into the middle atmosphere: A comparison of two general circulation models and ERA-40 reanalysis data. J Geophys Res 111:D06101. doi: 10.1029/2005JD006061
Garfinkel CI, Hartmann DL (2007) Effects of the El Niño–Southern Oscillation and the Quasi-Biennial Oscillation on polar temperatures in the stratosphere. J Geophys Res 112:D19112. doi: 10.1029/2007JD008481
Ineson S, Scaife AA (2009) The role of the stratosphere in the European climate response to El Niño. Nat Geosci 2:32–36. doi: 10.1038/ngeo381
Richter J, Deser C, Sun L (2015) Effects of stratospheric variability on El Niño teleconnections. Environ Res Lett 10:124021.
Scaife AA, Karpechko AY, Baldwin MP, et al (2016) Seasonal winter forecasts and the stratosphere. Atmos Sci Lett. doi: 10.1002/asl.598
Sigmond M, Scinocca JF, Kharin V V., Shepherd TG (2013) Enhanced seasonal forecast skill following stratospheric sudden warmings. Nat Geosci 6:98–102. doi: 10.1038/ngeo1698
Waugh DW, Sobel AH, Polvani LM (2016) What is the polar vortex, and how does it influence weather? Bull Am Meteorol Soc. doi: 10.1175/BAMS-D-15-00212.1
Comments
Polar vortex
Excellent summary!
Very Helpful and Well Done Article
Comprehensive study with exceptional educational format.
El nino and late frost
Beaufort High enhanced in spring 2016 led to sea ice melt
Comments have been disabled on this article