Beyond the Data Blog
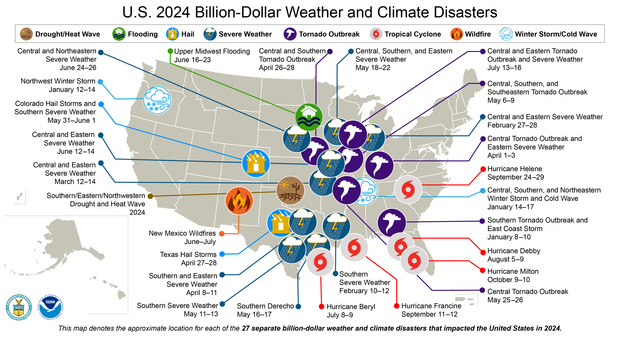
NOAA’s National Centers for Environmental Information (NCEI) has updated its 2024 Billion-dollar disaster analysis. In 2024, there were 27 individual weather and climate disasters with at least $1 billion in damages, trailing only the record-setting 28 events analyzed in 2023. These disasters caused at least 568 direct or indirect fatalities, which is the eighth-highest for these billion-dollar disasters over the last 45 years (1980-2024). The cost was approximately $182.7 billion.
This total places 2024 as the fourth-costliest on record, trailing 2017 ($395.9 billion), 2005 ($268.5 billion) and 2022 ($183.6 billion). Adding the 27 events of 2024 to the record that begins in 1980, th…
Read article
The NOAA National Centers for Environmental Information (NCEI) has released the final update to its 2023 Billion-dollar disaster report, confirming a historic year in the number of costly disasters and extremes throughout much of the country. There were 28 weather and climate disasters in 2023, surpassing the previous record of 22 in 2020, tallying a price tag of at least $92.9 billion. This total annual cost may rise by several billion when we’ve fully accounted for the costs of the December 16-18 East Coast storm and flooding event that impacted states from Florida to Maine.
2023 Highlights
In 2023, the U.S. experienced 28 separate weather and climate disasters costing at least 1 bil…
Read article

The NOAA National Centers for Environmental Information (NCEI) has released the final update to its 2022 Billion-dollar disaster report (www.ncei.noaa.gov/access/billions), confirming another intense year of costly disasters and extremes throughout much of the country. 2022 tied 2017 and 2011 for the third highest number of billion-dollar disasters. 2022 was also third highest in total costs (behind 2017 and 2005), with a price tag of at least $165.0 billion. This total annual cost may rise by several billion when we’ve fully accounted for the costs of the December 21-26 Central and Eastern winter storm/cold wave.
A note about images: The images in this post are screenshots from the Billi…
Read article
Christopher W. Landsea is the Chief of the Tropical Analysis and Forecast Branch at the National Weather Service's National Hurricane Center in Miami, FL. Tom Knutson is a Senior Scientist at NOAA’s Geophysical Fluid Dynamics Laboratory in Princeton, NJ. It should be noted that the following discussion represents the authors’ opinions only and does not represent any official position of NHC, NWS, GFDL, or NOAA in general. A NOAA State of the Science Fact Sheet on “Atlantic Hurricanes and Climate”, which has been reviewed by NOAA, is also available.
Last month, in a Beyond the Data blog post, we examined whether scientists can detect any significant change in Atlantic hurricane activity to…
Read article
Christopher W. Landsea is the Chief of the Tropical Analysis and Forecast Branch at the National Weather Service's (NWS) National Hurricane Center (NHC) in Miami, FL. Tom Knutson is a Senior Scientist at NOAA’s Geophysical Fluid Dynamics Laboratory (GDFL) in Princeton, NJ. The following discussion represents the authors’ opinions only and does not represent any official position of NHC, NWS, GFDL, or NOAA in general. A NOAA State of the Science Fact Sheet on “Atlantic Hurricanes and Climate”, which has been reviewed by NOAA, is also available.
Last summer, one of us (Chris) co-wrote a National Hurricane Center Inside the Eye blog post about the 2020 hurricane season and whether it…
Read article