September 2023 ENSO Outlook: An El Niño convo
Let’s cut right to the chase. According to the September El Niño-Southern Oscillation (aka ”ENSO”) Outlook, El Niño is expected to stick around (with greater than a 95% chance) at least through January-March 2024. There is now around a 71% chance that this event peaks as a strong El Niño this winter (Oceanic Niño Index ≥ 1.5 ˚Celsius). Remember, though, a strong El Niño does not necessarily mean strong El Niño impacts locally. Instead, it means a stronger chance that El Niño impacts will occur.
Let’s dive deeper into what’s going on across the Pacific in a patented ENSO Blog expert Q&A. And boy, oh boy, are you not going to believe who we were lucky enough to snag. Without further ado, introducing our two “experts”: the Pacific Ocean and the tropical atmosphere.
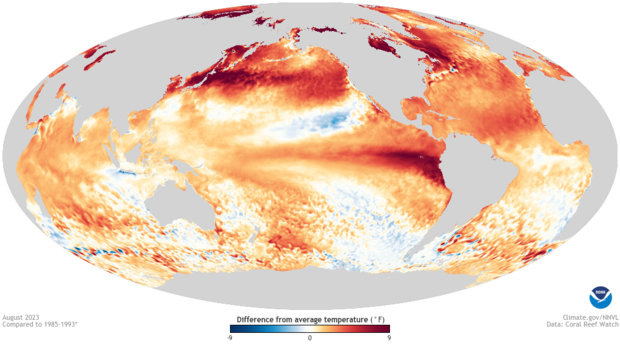
August 2023 sea surface temperature difference from the 1985-1993 average (details from Coral Reef Watch). Much of the global oceans are warmer than average. NOAA Climate.gov image from Data Snapshots.
ENSO Blog: Let’s start in the water. Pacific Ocean, big fan. Can you go over what “you” have been up to in the last month?
The Pacific Ocean: Hey, right back at you! It’s flattering that you have an entire blog dedicated to things going on in me. But let’s focus on what’s going on at my waist, what you call “the equator.” The main El Niño monitoring metric, the Niño-3.4 index—the average sea surface temperature in the central and eastern equatorial Pacific Ocean—was 1.3˚Celsius (2.3˚Fahrenheit) above the long-term average in August, up from 1˚C in July, according to the most reliable dataset, ERSSTv5 (long-term here is 1991-2020.) And the June-August Niño-3.4 index was 1.1˚C above the long-term average, making it the third consecutive three-month period in El Niño territory. And from what I’ve read on your blog, that means you are two more seasons away from an official “El Niño episode” in the historical record (the red in this table.)
Plus, judging from your weekly sea surface temperature datasets of my belly, the Niño-3.4 temperature anomalies are even higher during the first part of September, up to 1.6˚C.
EB: That’s pretty hot!
The Pacific Ocean: I’m pretty hot all over. In fact, my cousins the Atlantic, Indian, Arctic, and Southern Ocean are all pretty hot at the moment. Like record-breaking hot from April till now. So hot that the warmer-than-average ocean temperatures associated with El Niño happening in my central/eastern mid-section do not nearly stick out in the global picture as much as events in the past. It’s bonkers, if you ask me. The whole ocean was over 1˚C above the 20th-century average in August, the first time that’s happened in the 174-yr record. All us oceans have a fever!
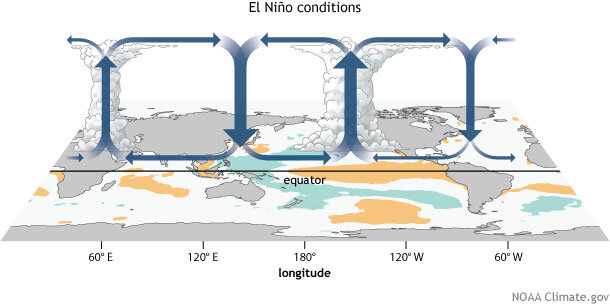
Generalized Walker Circulation (December-February) anomaly during El Niño events, overlaid on map of average sea surface temperature anomalies. Anomalous ocean warming in the central and eastern Pacific (orange) help to shift a rising branch of the Walker Circulation to east of 180°, while sinking branches shift to over the Maritime continent and northern South America. NOAA Climate.gov drawing by Fiona Martin.
EB: As we all know; El Niño doesn’t work if the atmosphere isn’t also playing. So, my next question is for the tropical atmosphere. What’s going on with you?
The tropical atmosphere: Thanks for having me. First-time guest, long-time reader. Believe me, El Niño’s got me all topsy-turvy. Normally when my Walker Circulation is acting like a well-oiled machine, there is rising, moist air over the warm western Pacific Ocean, sinking air over the eastern Pacific, and winds connecting those two branches: trade winds blowing east to west at the surface and west-to-east winds high up in the atmosphere. El Niño messes all of that up. And that’s what has been going on.
In August, the trade winds were weaker over the east-central equatorial Pacific. More thunderstorm activity than normal occurred farther east, extending from the international date line to the eastern Pacific Ocean, which is totally not where these storms typically reside. And then two important atmospheric metrics that you humans use, the Equatorial Southern Oscillation Index and the Southern Oscillation Index—which monitor how the surface air pressure changes between the western and eastern Pacific part of me—both were strongly negative in August, indicating an El Niño-like weakening of pressure in the eastern Pacific and higher than normal pressure in the west.
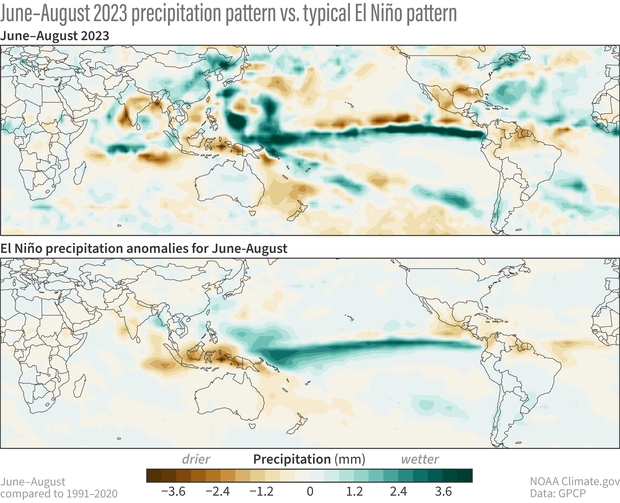
Comparison of the June-August 2023 precipitation anomaly patterns (top) to the El Nino patterns typical seen during June-August (bottom). June-August 2023 had similar patterns to that expected during El Nino. NOAA Climate.gov image based on image from Michelle L'Heureux using GPCP data.
EB: How similar have recent precipitation patterns been to El Niño?
The tropical atmosphere: Take a look at these images comparing the global precipitation anomalies from June-August 2023 to how I typically behave during El Niño. Oh, I’ve been very El Niño-like! Not only has precipitation been above-average across the equatorial Pacific Ocean, but it has also been below-average over northern South America, Central America, and parts of Indonesia and India.
Now, it’s not a perfect match. I know, I know…you’ll call me unreliable. Flighty. Chaotic, even. I prefer to say that I, the tropical atmosphere, never repeat myself. I give each El Niño its own special touch. Still, this year’s rainfall patterns are pretty close to previous years’ El Niños. In fact, based on a measure of pattern similarity between these two images, out of the 11 El Niño summers on record, June-August 2023 was the third-best match to what you all call the classic El Niño pattern (footnote #1). Only the summers of 1997 and 2015 were more like El Niño. Remember those events? Pretty big El Niños. So yeah, you could say that El Niño is having an impact on me.
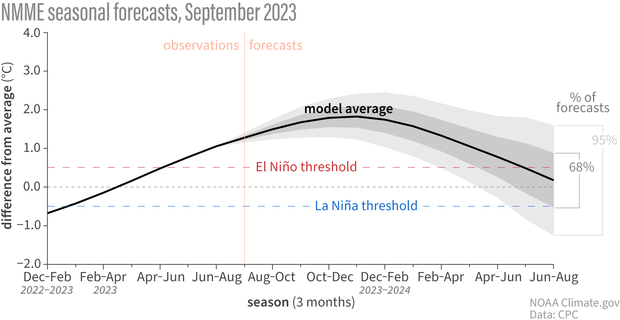
September 2023 climate model forecasts for the Niño-3.4 temperature anomaly in 2023-24 from the North American Multi-Model Ensemble (NMME). The black line shows the model forecast average; darker gray envelope shows the range of 68% of all model forecasts; lighter gray shows the range of 95% of all model forecasts. NOAA Climate.gov image based on a graph from Emily Becker.
The Pacific Ocean: How about we ask you a question now? ENSO Blog writer Tom, what can we, the Pacific Ocean and tropical atmosphere, expect from El Niño for the rest of the year?
Tom: Well, that’s a first. But great question! The global climate models we rely on are pretty certain that the currently observed warmer-than-average sea surface temperatures will last and even strengthen through winter 2023–24. After which, this El Niño event is expected to weaken, which is normal for these types of events.
The continued model confidence is one reason why forecasters have odds of over 70% that the current event will peak as a “strong” El Niño (Niño-3.4 index values greater than 1.5˚C) for the November-January average. There is even a 30% chance that Niño-3.4 values exceed 2.0˚C by this winter, which would put ocean temperatures in a tier with some of the strongest El Niños since 1950.
But to our readers, a few reminders from the ENSO Blog archive.
- You cannot blame EVERYTHING on El Niño.
- No two El Niños are alike, and the same goes for their impacts. And,
- Just because a strong event is forecasted does not necessarily mean strong impacts. Instead, El Niño can increase the chances for certain types of extremes.
That about does it for this month’s post on the ENSO Outlook. A special thanks to the Pacific Ocean and tropical atmosphere for taking some time out of their chaotic days and answering a few of my questions.
The Pacific Ocean: Of course! [waves goodbye]
The tropical atmosphere: An honor to be invited. [Blows a kiss]
Footnote
- If you look at the spatial (pattern) correlation coefficient between the two images, the coefficient is ~0.6, meaning that about 36% of the global spatial variability is explained by El Niño. This is a pretty large number as far as these things go!
Comments
This can be confusing…
This can be confusing because we often monitor SST anomaly data in degrees Celsius (departure from average). We convert SST anomaly data from Celsius to Fahrenheit (for anomaly) data by multiplying to 1.8. It really is that warm!
El Niño impacts on climate & climate impacts on ENSO
Thanks for this excellent, informative post. It is very interesting to see that as of September, El Niño is up to a 71% chance of a "strong" ENSO event heading into 2024. Just a few months ago it seemed it may be a "mild" one!
Anyhow, though ENSO phases are not drivers of climate shifts, they do temporarily drive climate records up (in the case of El Niño) or down (La Niña phase). Which makes the the past three-year La Niña event a bit of a head-scratcher: It "should" have brought slightly cooler temps to Earth's oceans and atmosphere; yet instead, we witnessed very warm anomalies for both. Indeed, the Niña three-peat did not reduce temp levels as much as had been hypothesized! And unusually, the Atlantic ocean warmth this year, is atypical compared against all prior first-year Niño data?
Not to "jump the gun" but does the data since the 2015-16 event suggest a rapid shift of sorts? Is there a chance future ENSO models require new inputs? That is, if the climate itself keeps warming, the "stable" conditions prior models may have taken for granted may not be statistically reliable in the face of an overarching climate shift: For example, (and though it certainly isn't the right analog!), the Pliocene epoch has been found to be locked more in a El Niño phase until various factors cooled the planet to conditions similar to today's Earth. Therefore today, even if conservative climate models predicting slight planetary warming are correct, is there a chance ENSO might be shifted to a prior systemic type - that isn't so well balanced between El Niño and La Niña?
One major advantage to using…
One major advantage to using dynamical, physics based climate models (run on large supercomputers) is that they are initialized with the observed conditions. Meaning if it is all over warm everywhere then the models should start from that point and then run forward using equations that describe the movement of our atmosphere/ocean. Many statistical based models based on past history (e.g. analogs) are probably at a distinct disadvantage if the climate changes rapidly then they will not find past cases that are comparable. With that said, scientists will be busy studying the current circumstances of this developing El Nino-- it does seem quite unique when compared to similar developing events.
Thanks for the succinct…
Thanks for the succinct reply!
From a lay perspective, the mechanics of the equations are fascinating, because one would assume they are largely informed by past history. Of course, this is a very simplistic take!
Even for people who try to be well-informed members of the public (who might be a minority!) there is a level of mystique and opacity in trying to understand the science. (And quite likely, this is the time when opacity has to be cleared!)
One of the features around Earth system climate models that has been slowly growing in popular parlance the last decade and half, is the notion of "Earth energy budget", sometimes called the "Earth energy imbalance". Do the equations factor this level of predictive physics into the observed data? This was the real question all along :-D
ESM's do capture El Nino and…
ESM's do capture El Nino and La Nina's which would affect earth energy budgets.
Spatial Variability
re the comment below... Would you please also provide the correlation between ENSO and US temperature and precipitation only?
Good question! I'll see what…
Good question! I'll see what I can find.
El Niño and Northern Vermont/Lake Champlain
Hello! I loved reading such a clever and creative post with complicated, technical science. Thank you! It kept me entertained and I couldn’t help thinking what a great article it would be for students learning about weather patterns as well.
thank you!
Thank you for your support, Sarah!
Good Writing
I'm a TV meteorologist who has to explain things to people that are very complicated, but put it in simple and engaging terms. This article pulled it off. Well done!
Comments have been disabled on this article