December El Niño update: phenomenal cosmic powers!
If you’ve been following the development of this El Niño, you may have heard in the media that sea surface temperatures in the central equatorial Pacific are at near-record highs. Are we seeing the most powerful El Niño ever?
Remember: ENSO is not all about the ocean
El Niño is one phase of the El Niño-Southern Oscillation (ENSO). An ENSO event involves changes in both the sea surface temperatures and in the overlying atmosphere across the tropical Pacific. In the case of El Niño, sea surface temperatures are warmer than average, and the Walker Circulation, which operates like a vertical loop through the tropical Pacific atmosphere—is weakened. This weakness shows up as more clouds and rain in the central and/or eastern Pacific and less over Indonesia, weaker near-surface winds (the trade winds, that usually blow from the east to the west), and weaker upper-level winds.
The whole system is important, because there are feedbacks between the ocean and the atmosphere that help to strengthen El Niño. For example, weaker near-surface winds let the surface waters warm in the central and eastern Pacific. The warmer waters lead to more convection (rising warm air), which changes the circulation and further weakens the near-surface winds… and so on! (Check out Tom’s post on the Walker Circulation for more details about the system.)
Another thing to remember about ENSO is that meaningful changes take place on seasonal timescales (the average over several months). The important effects of El Niño on the U.S. and other regions are related to its average strength over the fall and winter, not how strong it is on any particular day or week. We do monitor the weekly and monthly changes in the sea surface temperature and the atmosphere to get a hint at where things are headed, but we’ll ultimately judge the strength of this El Niño by its average over the seasons.
Yeah, yeah – what about this one??
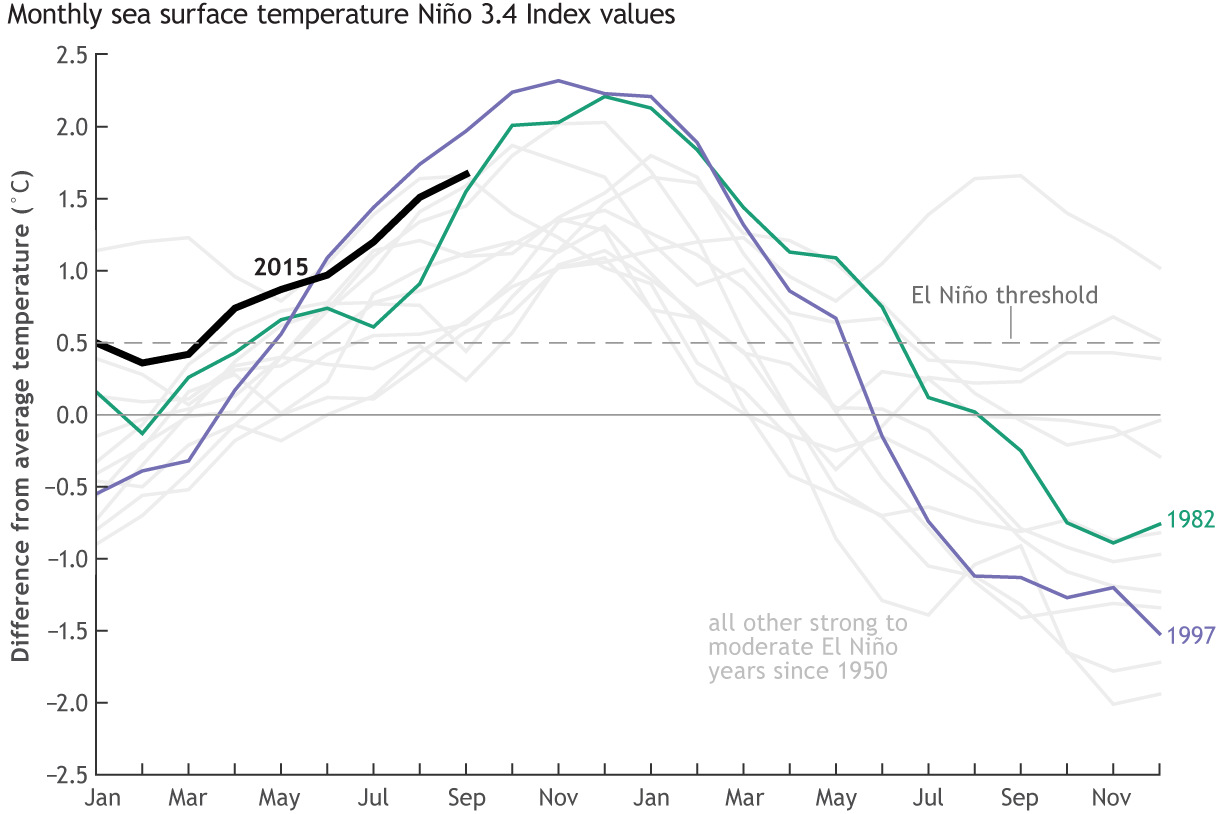
Right out of the gate, let’s talk about that November sea surface temperature in the Niño3.4 region. The ERSSTv4 data set shows that this November was 2.35°C warmer than the November average—tied with November 1997’s 2.33°C. (Yes, I know those numbers aren’t identical, but they’re within the statistical margin of error, which means as far as rankings are concerned, they’re tied.), This dataset has been carefully maintained to ensure that it is historically consistent, so it’s the best, most reliable one to use to compare 2015 to 1997 (or any other year.)
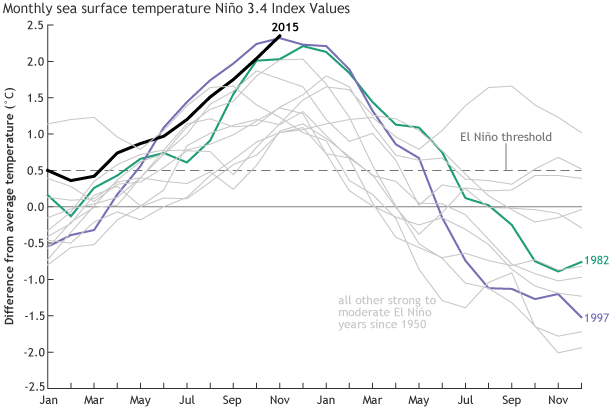
Monthly sea surface temperature in the Niño 3.4 region of the tropical Pacific compared to the long-term average for all moderate-to-strong El Niño years since 1950, showing how 2015 (black line) compares to other strong events. Climate.gov graph based on ERSSTv4 temperature data.
The Niño3.4 ERSSTv4 for September–November is 2.04°C, second to 1997’s 2.18°C. Since we’re looking at this El Niño very likely placing in the top three (with 1997-98 and 1982-83), let’s compare some of the other components of the system right now. I’m going to focus on 1997-98, since by most assessments that’s the strongest El Niño in our short, 1950-present record.
The atmosphere hasn’t been responding to the high ocean surface temperatures in the tropical Pacific in quite the same way as it did in 1997. For this next bit, remember that weaker winds = stronger El Niño response. In a side-by-side comparison of the near-surface winds during May-November 2015 and 1997, you can see that the anomalies (the departures from average) were larger during 1997 than 2015.
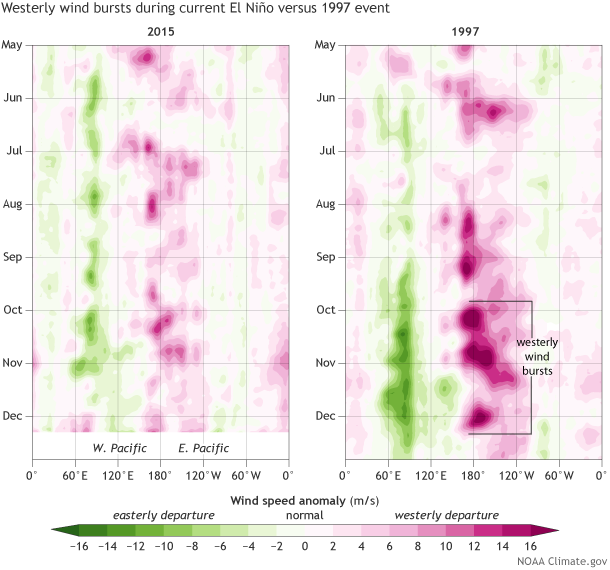
Near-surface wind anomalies over the tropical Pacific (5°N-5°S) in 2015 (left) compared to 1997 (right) in the months leading up to the winter peak of each event, starting at the top in May and ending in November (2015) and December (1997) at the bottom. Each row in this type of image is the departure from average (1981-2010) at that time. Westerly wind bursts (dark pink areas) were much stronger in fall 1997 than they have been this year. NOAA Climate.gov image, based on data provided by the Climate Prediction Center.
Wind anomalies can get a little confusing, because during an El Niño the normal easterly (blowing from east to west) winds weaken, and if they weaken enough, they turn around and blow from the west. This happened during October of 1997, when you can see the large anomaly.
If you average the September – November low-level winds over the central Pacific, you get about 8 miles per hour, trailing 1982 (1.5 mph) and 1997 (-2.5 mph) pretty substantially (positive numbers means the wind is blowing from east to west, and negative means west to east). The average wind speed of the trade winds this time of year is about 16 miles per hour.
Another measurement of the atmospheric response to El Niño’s warmer waters is the Equatorial Southern Oscillation: November 2015 is currently third, behind 1997 and 1982. While we’ve seen consistently more clouds than normal over the tropical Pacific this year (evidence of increased convection due to the warm water), this response has also been less than it was in 1997 over the central to eastern Pacific.
There is a lot we don’t understand about how El Niño works, and exactly why the atmospheric response is weaker in 2015 than it was in 1997, despite very similar east-central Pacific temperatures, is going to be a hot research topic going forward.
A look under the surface
The surface of the equatorial Pacific is where warmer-than-average ocean waters interact with the atmosphere. Those surface temperatures are driven by a large amount of warmer water under the surface: without a big source of warmth, short-term fluctuations would dominate and we wouldn’t have an El Niño. (Check out Michelle’s post on Kelvin waves for details on how this works.)
We monitor the ocean heat content in the upper 300 meters (about 1000 feet) of the equatorial Pacific. 2015 has had a large, consistently above-average ocean heat content since this El Niño began in March, as you can see below. However, a side-by-side comparison with 1997 reveals there is still not as much heat fueling this El Niño as there was eighteen years ago.
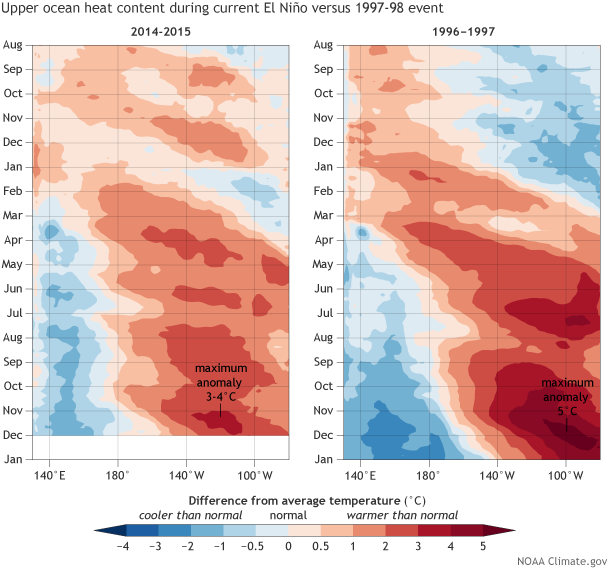
Heat content in the upper few hundred meters of the tropical Pacific (5°N-5°S) before and during the current El Niño event (left, August 2014-November 2015, top to bottom) and the 1997-98 event (right, August 1996-December 1997). Each row in this type of image is the departure from average (1981-2010) at that time. The maximum heat content anomalies during the peak of the 1997-98 event were as much as 5°C (darkest red), whereas this year, they are 3-4°C, and they cover a much smaller area. NOAA Climate.gov image, based on data provided by the Climate Prediction Center.
What does it all mean?
Every El Niño event is different, and even if there are some strong similarities between this El Niño and another, we’d be really surprised if everything lined up exactly the same. By most measures, this is one of the top three strongest El Niños since 1950, and there’s still a chance it could record the highest Oceanic Niño Index (the three-month-mean sea surface temperature anomaly in the Niño3.4 region, our primary ENSO metric). But ocean temperatures are just one way to measure ENSO, which can be tracked in many ways.
While the warmer-than-average ocean waters are likely reaching their peak about now, they will remain a huge source of warmth for the next several months to drive the main impacts on temperature and rain/snow over North America, which typically follow the peak. The main impacts season is December–March, so we’re just at the very beginning of finding out what this El Niño event will bring to the U.S. There’s no doubt that El Niño 2015-2016, which has already shown its power around the world, will have a significant effect on the U.S. winter.
Comments
Great blog
Global warming since 1998
RE: Global warming since 1998
We detrend the ONI (3-month-average Nino3.4 index) using a moving climatology. More details here. Both 2015 and 1997 anomalies are made against the same climatology (1981-2010).
RE: Global warming since 1998
RE: RE: Global warming since 1998
Recent work by Karl et al. indicate that there actually hasn't been a hiatus in warming (see NOAA press release). And in any case, 2015 is quite likely going to be the warmest year ever observed. Therefore hard to see how this is acting to influence impacts The reality is that climate is complex and far more than just El Nino, so it should't be surprising if some impacts vary from El Nino to El Nino.
http://www.noaanews.noaa.gov/stories2015/noaa-analysis-journal-science-…
El Nino
RE: El Nino
Interesting suggestion. The warm SST anomalies are more of a symptom than a cause, as they are mostly due to some persistent atmospheric conditions. However, everything is connected, and the dynamics of this El Nino event are going to be a research topic for some time to come.
CURRENT ELNINO
RE: CURRENT ELNINO
SST measurement
RE: SST measurement
There are a lot of different techniques that go into calculating these area-average temperatures, including different instruments, statistical interpolation methods, and even differences in software packages used to run the calculations. Tom's recent post gets into some of the details of the available SST datasets.
RE: RE: SST measurement
RE: RE: RE: SST measurement
I thought I would step in for Emily this week. Let me try to explain. The accuracy for a single SST-measuring thermometer is on the order of 0.1C. It may give a read-out to hundredths, but the last digit would be wobbling around as different water touched the sensor (on a ship, on on a buoy, for example). It could be recorded either to the nearest tenth or the nearest hundredth. But that's for one thermometer. We're trying to measure the Nino3.4 region, which extends over an enormous area. There are vast portions of that area where no measurements are taken directly (called in-situ). The uncertainty comes about because of these holes in coverage. Satellite measurements help tremendously with this problem. But they are not as reliable as in-situ measurements, because they are indirect (remote sensed) measurements. We've come a long way with them, but there are still biases that vary in space and from one day to another, and are partially unpredictable. These can cause errors of over a full degree in some cases. We hope that these errors cancel one another out, but it's not always the case, because they are sometimes non-random, and large areas have the same direction of error (no cancellation). Because of this problem of having large portions of the Nino3.4 area not measured directly, and relying on very helpful but far-from-perfect satellite measurements, the SST in the Nino3.4 region has a typical uncertainty of 0.3C or even more sometimes. That's part of why the ERSSv4 and the OISSTv2 SST data sets, the two most commonly used ones in this country, can disagree by several tenths of a degree. So, while the accuracy of a single thermometer may be a tenth or a hundredth of a degree, the accuracy of our estimates of the entire Nino3.4 region is only about plus or minus 0.3C. Sorry about this big disapointment. It bothers me also. We need thousands of ships evenly spaced across the region to get a truly accurate reading. It's not worth the money, so it isn't going to happen. If we improved satellite measurement technology, that could be the key.
RE: RE: RE: RE: SST measurement
RE: RE: RE: RE: RE: SST measurement
This revision of the October SST occurred because the ERSST has a time-centered filter that adjusts the numbers slightly. The centered filter requires the SST observation for the month following the month in question, which it uses as a quality control filter for the month before. In other words, the SST for all months will first have a preliminary estiate, shown right after the month is completed, but then a revised (and more final) value after the next month's estimate becomes available. So we don't get the final reading until at least 1 month following the end of any given month. This delayed revision is mentioned on the top of NOAA/CPC's page giving the ONI data (i.e., the ERSSTv4 data). The fact that this delayed revision is done is covered in some of the references at the bottom of Tom's blog post on SST datasets: https://www.climate.gov/news-features/blogs/enso/exactly-same-completel…
RE: RE: RE: RE: RE: RE: SST measurement
RE: RE: RE: RE: RE: RE: RE: SST measurement
No, the OISST data is not revised using the following month's data as the ERSST is. The OISST is not intended to necessarily be a homogeneous dataset over time, so there is no effort to process the current values as the past values were processed as is done for ERSST, where the month-after filter was found to increase the accuracty of the data for the month in question. (This added accuracy occurs most clearly in older data, but the procedure is continued in the present to maintain analysis homogeneity.) The OISST is used more for real time analysis, such as for model initialization and very short-term (e.g., 1 week) variations. The purposes of, and differences between, the OISST and ERRST are discussed more in Tom's blog, and the last 2 references provided even more detail: https://www.climate.gov/news-features/blogs/enso/exactly-same-completel…
RE: RE: RE: RE: RE: RE: RE: RE: SST measurement
RE: RE: RE: RE: SST measurement
RE: RE: RE: RE: RE: SST measurement
You're right! But this is more like a pub quiz - how many jelly beans are in the jar? Your friend guesses too many, you guess too few, and the answer is somewhere in the middle. The range of guesses gives you an indication of the uncertainty in the measurement. (I don't expect the pub would erupt in jubilation, anyway, though.)
2015 El Nino
Revision to October 2015 Nino 3.4 Region Temperature
el nino
El Nino
Spring Weather
RE: Spring Weather
The effects of El Nino in the US during spring and summer are not as strong or reliable as they are in the winter. As far as severe weather in spring is concerned, if you are talking about tornados and severe thunderstorms mainly in the central and even eastern US, there has been found a slight tendency for enhanced activity for La Nina rather than El Nino. But remember that during the severe weather season (April - June), ENSO is often weak, because it is typically a transition season. However, some years there is a marked ENSO signal then, such as April - June 2015, when El Nino conditions were definitely present. There is a SLIGHT tendency for warmer than average summers following an El Nino the previous winter, due to the lingering warming effects on the global temperature. The upper air heights are often above normal in the subtropics during that following summer, and sometimes that can extend into the interior of large continents like North America. But again, it is not nearly as reliable as the winter climate effects in the US. Those effects are in action right now, and should tilt the odds toward above-average temperatures in the northern tier of the US, including New England (especially north of Massachusetts).
Data Methods
RE: Data Methods
Do I detect a note of cynicism and distrust about how NOAA develops and maintains its ENSO-related SST data sets? Hmmm......okay, you have the right. To get you started, you might look into the two refereces that are listed last in Emily's recent blog, at https://www.climate.gov/news-features/blogs/enso/exactly-same-completel…; These show comparisons between at least two of NOAA's most heavily used SST data sets, and help explain their differences. I don't think bandpass filtering is used, but averaging over a time period, such as 1 week, is done, and that might have a similar effect of eliminating the highest frequencies. The main problem comes from using both remote SST measurements (from satellites) and directly measured SST (called "in situ") and accounting for temporally and spatially varying biases in the former ones as best possible. The satellite measurements have much better spatial coverage than the in situ measurements, but the latter are usually more trustworthy where they are available. I can understand that you may not trust the quality of the final products. I would say that they can be trusted to within about 0.3C most of the time. Your last comment, about this El Nino being less warm than it is being measured to be, doesn't make any sense to me, even if we accept your distrust. Why would you be any more suspicious that it is being overestimated than being underestimated? It doesn't fit in with your other statements. I would expect that you judge the ERSST to be closer to the truth than the OISST during this event. Is that correct? Remember, there are PLENTY of in situ measurments contributing to these SST estimates, and the Nino3.4 region is enormous.
RE: Data Methods
RE: RE: Data Methods
I'm not aware of anyone removing information. As is disclosed at the very top of our ONI page ( here ), there are small adjustments to the ONI values every now and then and this is disclosed in the peer reviewed papers on ERSST.
2015 vs. 1997
RE: 2015 vs. 1997
Yes, it's going to be a very interesting "horse race" among the 3 events. I agree that the 1997-98 will probably retain its number one rank. As for beating 1982-83 or not, it's going to be close! In terms of the ERSSTv4 SST data, we are currently running just a bit ahead of 1982-83, but in 1982-83 the SST slightly increased more for December, and stayed nearly as warm in January (using just 1-month average ERSSTv4) than it might do this December and January. So I wouldn't want to bet the farm either way, as fun as it might seem.
RE: RE: 2015 vs. 1997
ENSO 1 and 2 are much more normal than 1997-8
RE: ENSO 1 and 2 are much more normal than 1997-8
During some portion of the 1982-83 event and the 1997-98 event, the SST anomaly in the Nino1+2 region, which is in the far eastern tropical Pacific right along the coast of northern Peru and Ecuador, exceeded 4C. So far in this event the Nino1+2 SST anomaly has not made it to 3C, but was more than 2.5C for some of the months in middle 2015, including October. (I'm using the OISSTv2 for these statements, and remember that the OISSTv2 tends to have slightly stronger anomalies than the ERSSTv2 that's used for official historical diagnostics. We know that these two SST datasets are roughly proportional, even if one tends to be stronger than the other.) So this event doesn't have the extremes, at least so far, that the other two strongest El Ninos since 1950 had. The Nino1+2 SST index could still soar to hit 3C anomaly during the remainder of this event, if new westerly wind events in the western or central Pacific spur new strong Kelvin waves. A Kelvin wave that might have caused such warming right now, from a big wind event in October, does not seem to have amounted to much, other than maintaining a Nino1+2 anomaly of more than 2C. But "it's not over until it's over". I would mildly bet against it, but do not have high confidence at all. Remember also, perhaps most importantly, that anomalies during the February - May time frame result in much more dramatic local rainfall consequences than anomalies at the current time of year, because the average (climatological) SST is normally higher during February - May than now. It is the ACTUAL SST that matters more than the anomaly of the SST. So a 2.5C anomaly in spring 2016 could have significant climate impacts along their coastline even though it does not have them now.
December El Nino
RE: December El Nino
It's hard to make a medium-term (i.e., 2-week) prediction of the upper air flow for the very beginning of January. But, judging from past strong El Ninos, I would tend to expect your split flow pattern to emerge, and for you guys to dry up a bit while California (especially the southern half) starts getting more major storms that give them well above average rainfall. While most of the US has its strongest climate effects from ENSO during winter (December through mid-March), the West Coast's impact tends to happen just a bit later in the season, even if the El Nino itself starts winding down. So I'm not at all surprised that so far, the pattern of dryer in the Pacific Northwest and wetter in southern California has not yet appeared in earnest. It's possible that before that pattern does form, BOTH the southwest and northwest could receive alternating periods of pretty strong storm system passages.
Cosmic Powers
westerly winds
RE: westerly winds
I am not familiar with such a large equatorial storm. It can be looked up if needed. Do you know which hemisphere it was in? Tropical cyclones north of the equator do have westerly winds to their south, which would mesh with the ENSO-related westerly equatorial low-level wind anomalies. Do you have any idea which month, and which week within the month? Whatever is found, it's doubtful that a single storm could noticeably influence the progress of an ENSO episode. More likely, the existence of the ENSO state would influence cyclones outside of the approximately 12 degree hurricane-free band straddling the equator.
Thanks
Kansas City
Eastern Oz
Johannesburg, SA
Pattern shift
RE: Pattern shift
As we're entering the time of year when the response over the Pacific is typically strongest, we would certainly expect to see this pattern dominate the next couple of months. However, the climate system is not just El Nino, so it's also possible (if not likely) that we'll see some breaks in the pattern, as sub-seasonal modes of climate variability such as the Madden-Julian Osillation (MJO) exert some influence on the circulation over the Pacific.
Maximum Ice
RE: Maximum Ice
Nice thought! There is some speculation that maybe the large amount of warmth just north of the equator might have resulted in reduced equatorial winds on the equator (relative to 1997-98). I think there might be some physical support this, but it will take some research for it to be more than speculation.
However, I think sea ice or snow is unlikely to be a culprit of the warm SSTs just north of the equator.
RE: RE: Maximum Ice
Is the blob really gone? And is the RRR still there?
Comments have been disabled on this article