November El Niño update: It’s a small world
The peak of our current El Niño is expected to occur in the next month or so… but what does that mean? We measure El Niño events by how much warmer the surface waters in a specific region of the equatorial Pacific are, compared to their long-term average. The difference from average is known as the “anomaly,” and we use the average anomaly in the Niño3.4 region as our primary index for El Niño. When the index in this region is at its highest, we have our peak El Niño.
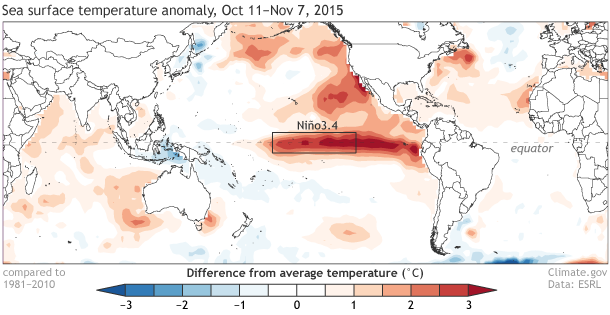
Average sea surface temperature departure from the 1981-2010 average over the four weeks ending on November 7. Graphic by climate.gov, data from NCEP-NCAR reanalysis.
However, El Niño-related impacts have been occurring around the globe for months already, and will continue for several months after the warmest temperatures occur in the tropical Pacific Ocean. For example, during the 1997-98 El Niño, the Niño3.4 Index peaked at 2.33°C in November (using ERSSTv4 data, the official dataset for measuring El Niño), and the most substantial U.S. effects occurred through the early spring of 1998. A bit later in this post, we’ll take a look at what’s been going on so far this year.
First, a quick update on the recent El Niño indicators
The average anomaly in the Niño3.4 region during August-October of this year was 1.7°C, second to the same period in 1997 (1).
Ranking of August-October average sea surface temperature departures from the mean for all El Niño episodes since 1950. This measurement, the Oceanic Niño Index, uses ERSSTv4 data. Figure by climate.gov, data from CPC.
The atmospheric response to the warmer waters is going strong. The Walker Circulation (tropical near-surface winds blowing from east to west, and upper-level winds blowing from west to east) is substantially weakened, as we expect during a strong El Niño.
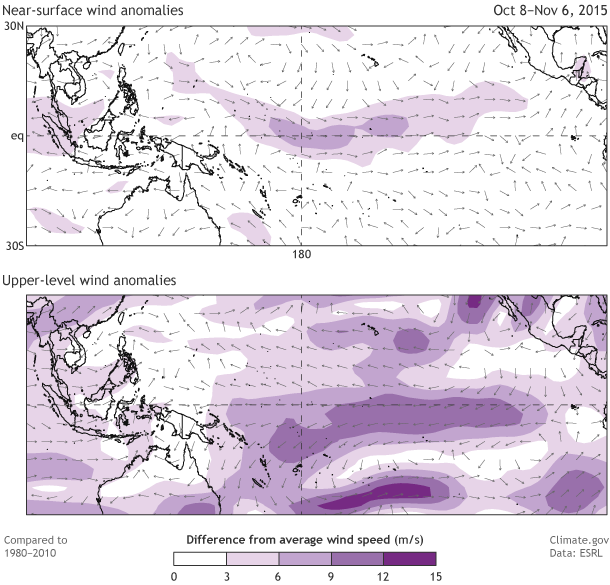
Top: Recent departure from the 30-year average near-surface winds. Purple shading area indicates where the normally easterly (blowing from east to west) winds are weaker than normal. Bottom: Recent departure from the 30-year average upper-level winds in the tropical Pacific region. Purple shading area indicates where the normally westerly (blowing from west to east) winds are weaker than normal. Maps by climate.gov, data from NCEP-NCAR reanalysis.
In case you’re unimpressed by a 2°C (3.6°F) change, let’s do a little math. The area covered by the Niño3.4 region is a little more than 6 million square kilometers (2.4 million square miles). One cubic meter of water weighs 1,000 kg. So the top two meters (6.6 feet) of the Niño3.4 region contains about 12 quadrillion kilograms (about 13.6 trillion tons) of water.
The energy required to raise one kilogram of water one degree Celsius (the “specific heat”) is 4.19 kilojoules. A 2°C increase in just the top two meters of the Niño3.4 region adds up to an extra 100 quadrillion kilojoules (95 quadrillion BTUs), about equal to the annual energy consumption of the U.S.!
Who’s feeling the effects?
In the U.S., the season of strongest El Niño impacts is December through March. While we’re waiting to see what the strong 2015-16 El Niño brings us, we’ll look around a few other corners of the world to see what’s happened so far.
El Niño has substantial impacts in two regions of Africa. I checked in with the Climate Prediction Center’s International Desk to see what’s been going on. In East Africa, including Ethiopia, Somalia, Kenya, Tanzania, Uganda, Burundi, and Rwanda, the primary impact season is October–December, when El Niño tends to enhance the ”short rains” rainy season (the “long rains” season, which is much less ENSO-sensitive, is March-May), leading to wetter conditions. Over the last month, rain has begun to increase across much of the area, and some flooding has been seen in Somalia. Short-term forecasts suggest the wetter conditions should continue through the next few weeks, at least.
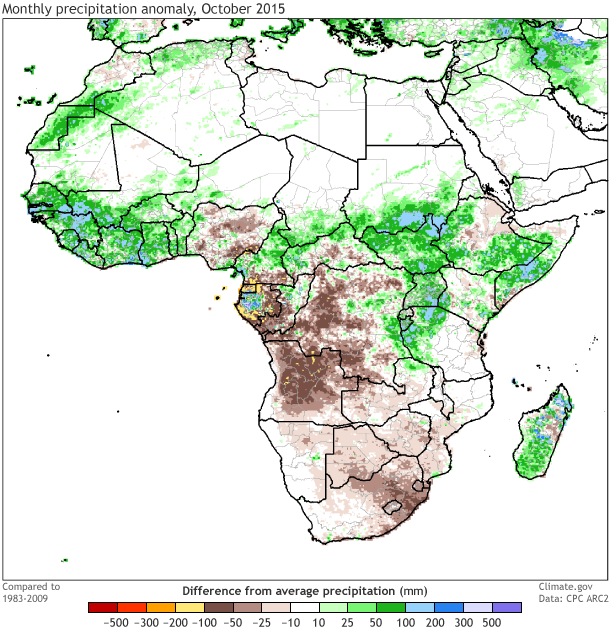
Monthly precipitation departure from the long-term average during October 2015. Map by climate.gov, data from the CPC ARC2.
Southern Africa, including Zimbabwe, Botswana, Namibia, Angola, South Africa, Lesotho, Swaziland, and the southern half of Mozambique, tends to see a drier December–February during an El Niño. Areas of this region, especially South Africa, are very dry right now, after a failed monsoon last year. Another dry year would place more stress on water availability. You can check out recent rainfall conditions in Africa here, and see climate model forecasts for the continent here.
In a couple of short sentences, here are some huge impacts: El Niño-related dry conditions in Indonesia have set the stage for devastating fires, and the region is experiencing the greatest number of forest fires since 1997. Also, all the extra warm waters associated with this El Niño are placing heat stress on sea life, and an intense coral bleaching event is underway.
El Niños tend to enhance the hurricane season in the Pacific, and depress the Atlantic hurricane season. Phil Klotzbach of Colorado State University had this to say about the wild Pacific hurricane season: “So far this year, there have been a total of 21 Category 4 and 5 storms in the North Pacific, shattering the old record of 17, set in 1997. The North Central Pacific region (140-180W) has shattered records for most named storms, hurricanes, and major hurricanes tracking through the 140-180W region.”
According to Lindsey Long of the Climate Prediction Center, the Atlantic season has been fairly quiet, although the number of named storms has been close to average, at 11 storms so far (including Kate, which formed on Monday). The average is about 12… but the overall activity of this storm season (the combined strength and duration of all storms, measured as the Accumulated Cyclone Energy (ACE) has been less than 60% of average, and we’ve had 3 hurricanes, half the average number of 6.
We won’t know until next spring what exact impact this El Niño will have on the U.S., but it is already making its presence felt around the world.
(1) Note that CPC subtracts past 30-year “normals” from the current sea surface value to obtain the Nino-3.4 anomaly values, and the “normals” are updated every five years. Therefore, the long-term trends are removed. These monthly values are averaged together to obtain our Oceanic Niño Index [ONI].
Comments
looking forward to some rain (hopefully)
El Nino brings lower crime
Article
Good Read
climate-wind strength long term trends
RE: climate-wind strength long term trends
Wow, you really go back a long way, talking about Joe Fletcher. MANY scientists have picked up where he left off. To name just a small subset: Gene Rasmussion, Mark Cane, Steve Zebiak, Max Suarez, Paul Schopf, Mike McPhaden, Chet Ropelewski, Tim Barnett, Kevin Trenberth, Mojib Latif, Ants Leetmaa, Ming Ji, Arun Kumar, Marty Hoerling, Tim Stockdale, Tim Palmer. I'm sure I'm omitting some others. I guess by "wind strength around the world", you're referring to the angular momentum studied by Rick Rosen, am I right? And during ENSO there is a perturbation in it. Sun intensity? How do you relate that (e.g., the 11-year cycle) to ENSO? COADS? Are you back in the 1990s still? Yes, we still use ship and buoy SST observations, and combine them with satellite measurements for some of the current SST data sets. You should check out the ERSST data set and the OISST data set. A lot has been going on since the 1990s!
RE: RE: climate-wind strength long term trends
Facinating
Thank You
RE: Thank You
RE: RE: Thank You
RE: Thank You
Atlantic Hurricane
RE: Atlantic Hurricane
Yes, in a strong El Nino such as this one, Florida is expected to have above average winter rainfall, and some of the rain may come with storminess in terms of wind, but nothing dangerous. Besides giving Florida a wet winter, El Nino usually also results in a quieter hurricane season in the preceding summer and fall, and that is indeed what has been observed during the last several months. El Nino's effects on both the effect on hurricanes and on Florida's winter rainfall have known physical causes.
ENSO and Rainfall in Southern Carribean
RE: ENSO and Rainfall in Southern Carribean
During winter and early spring (next 5 months), the usual effect of El Nino on southeastern Caribbean region is for below average rainfall. That region shares its impact with northern South America. It is the opposite effect from the above average rainfall expected in the northern Caribbean and southeastern US. After mid-spring, effects are unknown, partly because the El Nino is expected to dissipate around that time.
RE: ENSO and Rainfall in Southern Carribean
Rainfall in Coastal California
RE: Rainfall in Coastal California
Believe you mean 1997/98, but I know what you mean. As far as timing rainfall into California, that's really beyond the state of the science. The current oulooks for the rest of November and December are equal chances, which means there's no strong signal or tilt in the odds for wetter or drier than normal weather. However, the lack of significant rainfall during the early part of the winter is not unusual with El Nino, as the best chance for above normal rainfall is typically during the January - March season.
Can I translate this to Spanish?
Nino 3.4 Region SST Anomaly for Week Centered on 11 NOV 2015
RE: Nino 3.4 Region SST Anomaly for Week Centered on 11 NOV 2015
There's no way to convert between the weekly OISST value and the seasonal ONI value, since they use different underlying data sets. For the past few months, the data set used for the ONI (ERSST) has been running a bit more than 0.5C cooler than the OISST. You can read more about the different data sets in this blog post:
https://www.climate.gov/news-features/blogs/enso/exactly-same-completel…
addition
Peru Area
RE: Peru Area
The ENFEN committee provides El Nino updates regularly for Peru. Here is a link to their updates.
Rainfall in Central Coast California
RE: Rainfall in Central Coast California
The current seasonal forecasts have a tilt toward above normal rainfall during both the December - February and January - March seasons. There's not much else we can say at this time, although it's worth remembering that during the other two strongest events (1982/83 and 1997/98) there were numerous signifcant storms with much above normal preciptiation, particularly from the middle of the winter into the beginning of the spring.
La Nina
RE: La Nina
While we currently expect this El Nino to transition to neutral by next summer, what comes next is still an open question. It's really just too far into the future to make a prediction that would be anything except a guess. The 1997/98 did quickly transition to a La Nina, but the Pacific ocean after the 1982/83 event only became marginally below average and the La Nino didn't develop until the following winter (1984/85).
La niña
snowfall in the Rockies
RE: snowfall in the Rockies
Depends on where you're planning on skiing. Often, snowfall in the northern rockies is less than normal, while above normal in the southern Rockies.
RE: snowfall in the Rockies
Great post, thank you
El Nino effect in Thailand
SST
RE: SST
Great question... I'm not an expert on this topic, but my understanding is that different observing systems (ships, buoys, etc) do measure "SST" at slightly different depths. Almost all do so within the upper several meters of the ocean, but depths can vary. When putting together SST datasets, the experts do account for this at least implicitly by adjusting the various types of observing systems so they are more consistent.
Southern California Rain
RE: Southern California Rain
Too early to call it a bust given that the higher chances for precipitation are not until the core winter months. Best chances are January-March. Also, keep in mind that there are no guarantees in seasonal climate outlooks.... our forecasts state there are increased odds (%) for precipitation, but certainly not assured. See CPC's latest outlooks here: http://www.cpc.ncep.noaa.gov/products/predictions/long_range/seasonal.php?lead=1
Niño
RE: Niño
Here is one resource showing the chances of precipitation (below, near, above) for the upcoming seasons:
http://iri.columbia.edu/our-expertise/climate/forecasts/seasonal-climate-forecasts/
El Nino effects on the Galapagos
RE: El Nino effects on the Galapagos
We hope to have a blog article posted this week on the Galapagos. So stay tuned!
Effects of El Niño on Yucatán
RE: Effects of El Niño on Yucatán
El Nino impacts are very minimal b/c January is the dry season.
Still waiting for rain in California.
RE: Still waiting for rain in California.
The main precipitation impact for Calfornia -- especially during stronger El Ninos -- is during the January-March average period. While El Nino makes precipitation more likely, it doesn't offer guarantees for all of California (higher odds are for southern California).
STRANGE El NiNo
Thanks
Comments have been disabled on this article