What to expect this winter: NOAA’s 2015-16 outlook reveals what conditions are favored across the US
Four years of drought in California. Back-to-back cold and snowy winters over the Midwest and Northeast, while balmy in the West. What’s next, thunder, hail, or maybe locusts and frogs? Or will this winter bring more “normal” winter weather? Actually thunder and hail isn’t too far-fetched this winter, at least in the Southeast, but more about that later. The jury’s still out on the locusts and frogs. So what can we expect this winter?
The Climate Prediction Center's Mike Halpert gives us the highlights of the 2015-16 winter climate outlook for the United States.
Since this post is appearing on the ENSO blog, readers are well aware that El Niño developed last spring and is currently among the strongest events on record back to 1950. In addition, previous posts have discussed how El Niño can impact the weather and climate over the United States, particularly during winter. El Niño in general acts to tilt the odds toward wetter and cooler than average conditions across much of the South, and toward drier and warmer conditions in many of the northern regions. These effects vary from one El Niño to another, however.
Historical Patterns
Starting with precipitation, the figure below shows winter (December-February) differences from average precipitation for 20 El Niños between 1950 and 2010. The precipitation departures are in shown in order from the strongest event (1997/98) to one of the weakest (2004/05) (1).
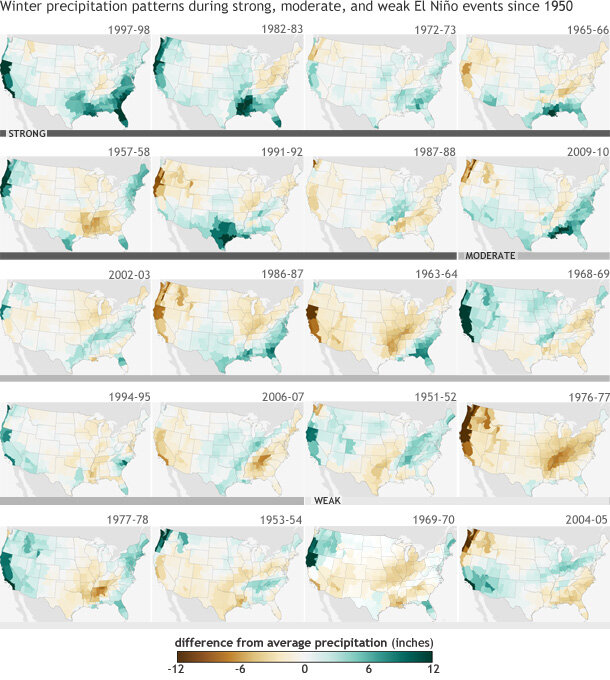
Difference from average (1981-2010) winter precipitation (December-February) in each U.S. climate division during strong (dark gray bar), moderate (medium gray), and weak (light gray) El Niño events since 1950. Years are ranked based on the maximum seasonal ONI index value observed. Maps by NOAA Climate.gov, based on NCDC climate division data provided by the Physical Sciences Division at NOAA ESRL.
The most consistent signal is along the Gulf Coast, where almost all of the strong episodes were associated with greater than average precipitation. Other fairly reliable signals for the stronger events include a tendency for below average precipitation in the Ohio and Tennessee Valleys and above-normal precipitation in southern California and the Southwest. Of course, these impacts are not ensured during every El Niño, not even the strongest ones.
The companion temperature figure shows more variability than the precipitation maps, even for just the 6 strongest episodes. The CPC forecasters take this greater variability into account which helps explain why forecast probabilities tend to be a bit higher for a precipitation outlook than a temperature outlook during El Niño winters.
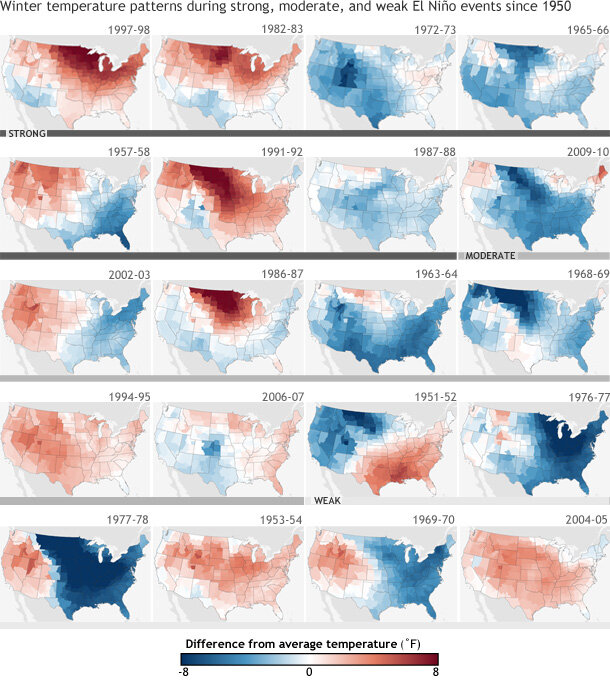
Difference from average (1981-2010) winter temperature (December-February) in each U.S. climate division during strong (dark gray bar), moderate (medium gray), and weak (light gray) El Niño events since 1950. Years are ranked based on the maximum seasonal ONI index value observed. Maps by NOAA Climate.gov, based on NCDC climate division data provided by the Physical Sciences Division at NOAA ESRL.
For the six strong events, three of them (1997/98, 1982/83, and 1991/92) are very similar with a dearth of below-average temperatures as much of the country (especially in the northern and central regions) experienced above-average temperatures. However, somewhat surprising is the generally cooler appearance in the other three cases, all prior to 1980. Admittedly it’s not wise to draw conclusions from such a small number of events, but it’s interesting that there may be decadal variability, which are ups and downs acting on a much longer (10 or more year) time scale, superimposed on these six cases, something not evident in the precipitation cases.
Current Outlooks
Although the seasonal outlooks issued by the Climate Prediction Center (CPC) are based on more than just El Niño, during a strong event, like the one we’re having, it certainly plays a large role. Still, CPC forecasters consider other factors, such as long term trends, as well as input from a suite of statistical tools and dynamical models.
And before discussing the actual winter outlook, I want to remind folks that these are tercile-based probabilistic outlooks with the most likely of the three categories (below normal, near normal, and above normal) shown on the maps (2). “Tercile-based” means that at every location, the forecast includes three probabilities: the chance for precipitation that is below average by a sufficient margin to be in the wettest one-third of the historical record, the chance for likewise except above average, and the chance for near-average precipitation (i.e., in the middle one-third of the historical record). We can’t put all three colors on the map in the same place, so we choose the color based on the category having the highest probability.
In other words, this does not mean that if you’re in a particular location that has a color on it, you will definitely experience climate departures that match the color. The outlooks show the most probable outcome, which means—as we’ve explained in earlier blog posts—that there is still always a chance that a less favored outcome will occur.
The CPC winter precipitation outlook favors wetter-than-normal conditions across the southern tier of the nation extending northward along the East Coast, and in southeastern Alaska. Drier-than-normal conditions are favored in western and central Alaska, Hawaii, parts of the Pacific Northwest and northern Rockies and around the Great Lakes and Ohio Valley. This pattern is quite consistent with the average precipitation patterns seen during previous El Niño winters.
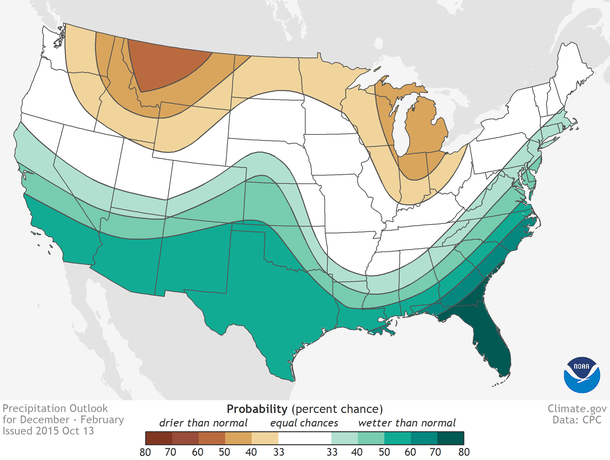
National precipitation outlook for December-February, issued October 15, 2015. Large version shows Alaska, Hawaii, and Puerto Rico. Colors indicate the probability of above- or below-average precipitation, not how far above or blow average the precipitation is likely to be. White indicates equal chances for any outcome—above-, below-, or near-normal precipitation—not a prediction of normal conditions. Map by NOAA Climate.gov, based on data from the Climate Prediction Center.
Probabilities are quite high this year across parts of the country—particularly in the Southeast, where the chance of a wetter-than-normal winter exceeds 70% for much of Florida (3). And while this is not something that CPC specifically forecasts at this time, this area also has the potential to see severe weather, since during El Niño winters, organized tornado activity is often restricted to the area immediately adjacent to the Gulf of Mexico (Cook and Schaefer 2008, Allen et al. 2015).
The chance of a wetter-than-normal winter exceeds 50% from the Southeast coast, along the Gulf Coast, across most of Texas, and through the Southwest to southern California. This is certainly positive news for California, although even a wet winter would be very unlikely to eradicate 4 years of drought. But you’ve got to start somewhere. On the flip side, the largest probabilities for below-average precipitation exceed 50% in the Northern Rockies, a region where drought has recently developed and is likely to persist or intensity through the winter.
The temperature outlook favors a warmer-than-normal winter over Alaska, much of Hawaii, the Western United States, and across the northern half of the contiguous U.S., while below-normal temperatures are favored across much of the south-central and southeastern regions. Probabilities for above-normal temperature exceed 60% in the Pacific Northwest, the Alaskan Panhandle and the extreme northern Great Lakes (4).
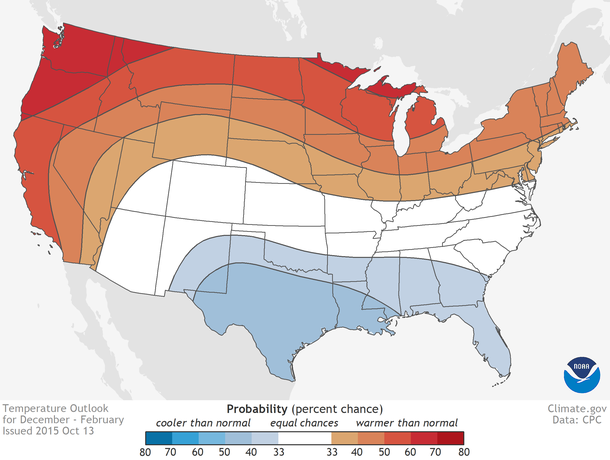
National temperature outlook for December-February, issued October 15, 2015. Large version shows Alaska, Hawaii, and Puerto Rico. Colors indicate the probability of above- or below-average temperatures, not how far above or blow average the temperature is likely to be. White indicates equal chances for any outcome—above-, below-, or near-normal temperature—not a prediction of "normal" conditions. Map by NOAA Climate.gov, based on data from the Climate Prediction Center.
The chance of a milder-than-normal winter in the Northeast is also enhanced (5), because it exceeds 33.33%, but is less than 50%. The likelihood of below average temperatures across the South is also enhanced but less than 50%. Also note that both maps include areas where neither above- nor below-normal is favored. Those areas are shown in white, which represents “equal chances,” and it means that the odds for below-, near-, or above-normal conditions are all equal, at 33.33% (6). The “equal chances” forecast means that upon considering all of the relevant factors, we see no reason for favoring any of the three categories.
Making seasonal forecasts is a very challenging endeavor. Seasonal climate models are not as skillful as weather models, and phenomena like El Niño or La Niña only provide clues as to what might occur during an upcoming season, although the occasional strong episode certainly provides stronger clues than usual. CPC issues probabilistic seasonal forecasts so users can take risk and opportunities into account when making climate-sensitive decisions. However, probabilities this winter are as high as you’ll ever see for a seasonal outlook, so if I were ever going to pay attention to them, this would be the year. If you live somewhere in the South and were thinking about replacing your roof in the next 6 months, I might do it before winter, instead of waiting until afterward.
Footnotes
(1) This list is slightly different from what appeared last June, as the underlying data set used to calculate our Oceanic Niño Index (ONI; the 3-month average SST departure from average in the NINO3.4 box in the east-central tropical Pacific) was changed, shuffling a few of the episodes around. Also, note that these years are ranked by the peak ONI value that was achieved during the second half of the year or very early in the following year, which may not be in DJF.
(2) The terciles are the boundaries that define three categories of the precipitation or temperature: “below normal (A)”, “near normal (N)” and “above normal (A)”. The two tercile boundaries (one separating B and N, the other separating N and A) are defined such that over a recent 30-year historical period, one-third of the years (10 out of the 30) have been in each of the three categories. The tercile-based probability forecasts then consist of the probabilities that the precipitation or the temperature will be in each of the three categories. In order to show the forecast on a single map, only the probabilities of the most likely category are shown. However, the probabilities for the less likely categories are also defined, even though they are not shown on the map. The white areas on the map show where all three probabilities are forecast with equal probability (33.3%).
(3) This also means that the likelihood of a drier-than-normal winter is very low, only 3% (although still not zero).
(4) This means that for these regions, in addition to a fairly high chance of a warmer-than-average winter, there’s also less than a 10% chance winter temperatures will be in the below normal category.
(5) Any probability above 33% is considered “enhanced,” because 33% is the expected climatological average probability when there are designed to be three historically equally likely categories. When the probability is above 33% but less than 50%, the given category has higher probability than its historical 33% average, but may be the most likely of the three categories but is nonetheless more likely not to occur than to occur. This effect from the use of three categories, instead of just two (such as simply “below average” vs “above average), is a source of confusion for some readers and users of the forecast.
(6) This “equal chances” forecast means that there’s no tilt in the odds toward any of the 3 categories. Note that this does not indicate a preference for the near normal category, as either of the other two categories is also equally likely. It indicates an informed “we do not know.” By “informed” we mean that we did our homework and still find no cause for favoring any of the categories over the others.
Lead reviewer: Tony Barnston, IRI.
References
A. R. Cook and J. T. Schaefer, 2008: The Relation of El Niño–Southern Oscillation (ENSO) to Winter Tornado Outbreaks. Mon. Wea. Rev., 136, 3121–3137.
Allen, J.T., Tippett, M.K., Sobel, A.H. (2015). Influence of the El Niño/Southern Oscillation on tornado and hail frequency in the United States. Nature Geoscience, 8, 278–283.
Comments
Winter weather
RE: Winter weather
We don't issue snowfall/ outlooks because snow (and ice) is the result of weather-scale storm systems that require both precipitation *and* cold enough air. The latter is harder to come by across the southern U.S. With that said, given the tilt of the outlook toward both cooler-than-average conditions and more precipitation, it is certainly possible! Though, the right ingredients have to come together on a given day.
Snow
RE: Snow
Thanks for the comment. As Michelle said in a reply above. We do not issue snowfall outlooks because snow is often the result of storm systems that need both precipitation and temperatures that are just cold enough. So while we may forecast a tilt in the odds for above-average precipitation for Asheville, it is harder to say whether temperatures will be cold enough for snow. However, given the outlook, it certainly is possible.
Models
Typo?
RE: Typo?
Good catch! Thanks - we'll try to get it corrected.
RE: Typo?
RE: RE: Typo? (radio waves blocking rain?)
Shreveport, LA outlook
El Nino based climatology
RE: El Nino based climatology
While El Nino is a strong driver of climate conditions, there are a lot of other factors at work, too. These include climate change trend and land surface conditions, as well as many others. The forecasters take these into consideration when making the forecast.
Timing
RE: Timing
Thanks for this great question. The probabilities apply to the entire season. So there's a 73% chance that, when winter is over in Florida, the season's total rainfall will be above average. You're right to think that there will be periods within the seaon that will have more rain, and periods that will have less, but our forecast is for the seaonal average. The same goes for temperature - while it's not possible to forecast exactly what days or weeks in the season will be warmer or cooler than normal, the forecast makes a prediction for the average over the whole three months.
El Nino
RE: El Nino
The type of information you seek is not available to my knowledge. While this information maybe obtained based on past El Ninos, no two events provide exactly the same impacts across the United States. The National Center for Environmental Information has a webpage that provides information based on the 6 strongest El Ninos, which may be of interest to you.
https://www.ncdc.noaa.gov/news/historical-perspective-el-ni%C3%B1o
El Nino and Arctic Oscillation
RE: El Nino and Arctic Oscillation
ENSO and the AO are only weakly related to one another, at best. While the northern winter ENSO state is fairly well predicted (since it is often a continuation of what exists in the autumn), the AO is poorly predicted, and knowing ENSO does not help much at all in predicting the AO. The AO is considered somewhat of a wild card as far as a winter temperature forecast is concerned, even though we know what its impact on eastern US temperature would be if we just knew what it was going to do. Some degree of predictability of the winter AO (or NAO for the portion of the AO that affects the eastern US) has been claimed in some research by Judah Cohen, using the amount of snow cover over Eurasia during the preceding autumn. He actually issues forecasts each year for AO/NAO based on this snow cover. I don't know that these forecasts have a proven track record, though. You might want to look up his journal publications. The phase of the AO/NAO has a greater effect on eastern US temperature than ENSO, so it is a big deal in terms of contribution to the uncertainty of the temperature forecasts. When AO/NAO is is positive phase, much more the eastern US is above average in temperature during an El Nino than when it is not, in which case the area of above average temperature from the El Nino is limited to regions farther north, such as northern New England and other areas currently forecast to have a tilt of the odds toward above normal in the current climate forecasts issued by Climate Prediction Center.
Comments have been disabled on this article