What is the El Niño–Southern Oscillation (ENSO) in a nutshell?
Go to any agency that is focused on weather or climate forecasting and you’ll hear scientists buzzing to one another about “ENSO” (pronounced “en-so”). After glancing at the stereotypical scientist, you might immediately assume “En-so” is a Star Wars character, but you would be mistaken. ENSO is one of the most important climate phenomena on Earth due to its ability to change the global atmospheric circulation, which in turn, influences temperature and precipitation across the globe. We also focus on ENSO because we can often predict its arrival many seasons in advance of its strongest impacts on weather and climate.
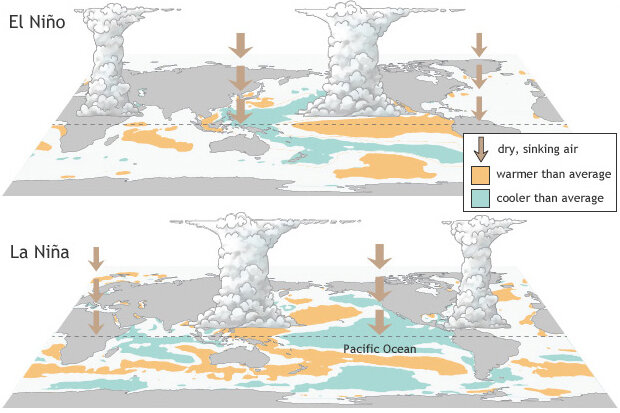
Though ENSO is a single climate phenomenon, it has three states, or phases, it can be in. The two opposite phases, “El Niño” and “La Niña,” require certain changes in both the ocean and the atmosphere because ENSO is a coupled climate phenomenon. “Neutral” is in the middle of the continuum.
- El Niño: A warming of the ocean surface, or above-average sea surface temperatures (SST), in the central and eastern tropical Pacific Ocean. Over Indonesia, rainfall tends to become reduced while rainfall increases over the tropical Pacific Ocean. The low-level surface winds, which normally blow from east to west along the equator (“easterly winds”), instead weaken or, in some cases, start blowing the other direction (from west to east or “westerly winds”).
- La Niña: A cooling of the ocean surface, or below-average sea surface temperatures (SST), in the central and eastern tropical Pacific Ocean. Over Indonesia, rainfall tends to increase while rainfall decreases over the central tropical Pacific Ocean. The normal easterly winds along the equator become even stronger.
- Neutral: Neither El Niño or La Niña. Often tropical Pacific SSTs are generally close to average. However, there are some instances when the ocean can look like it is in an El Niño or La Niña state, but the atmosphere is not playing along (or vice versa).
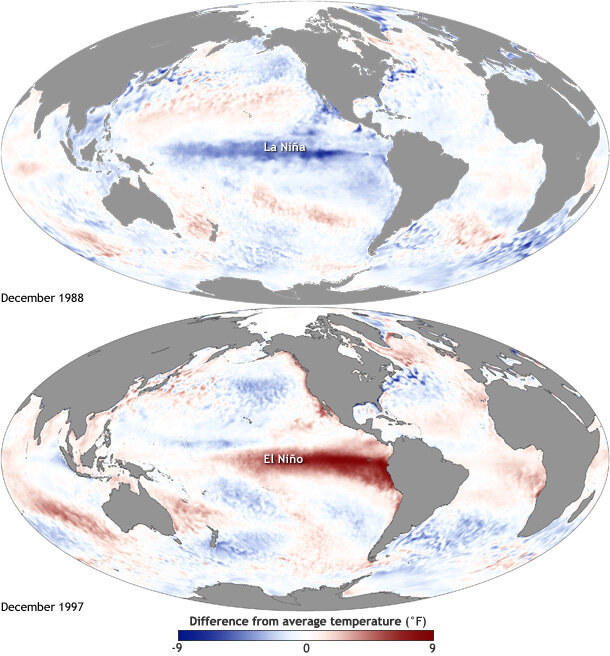
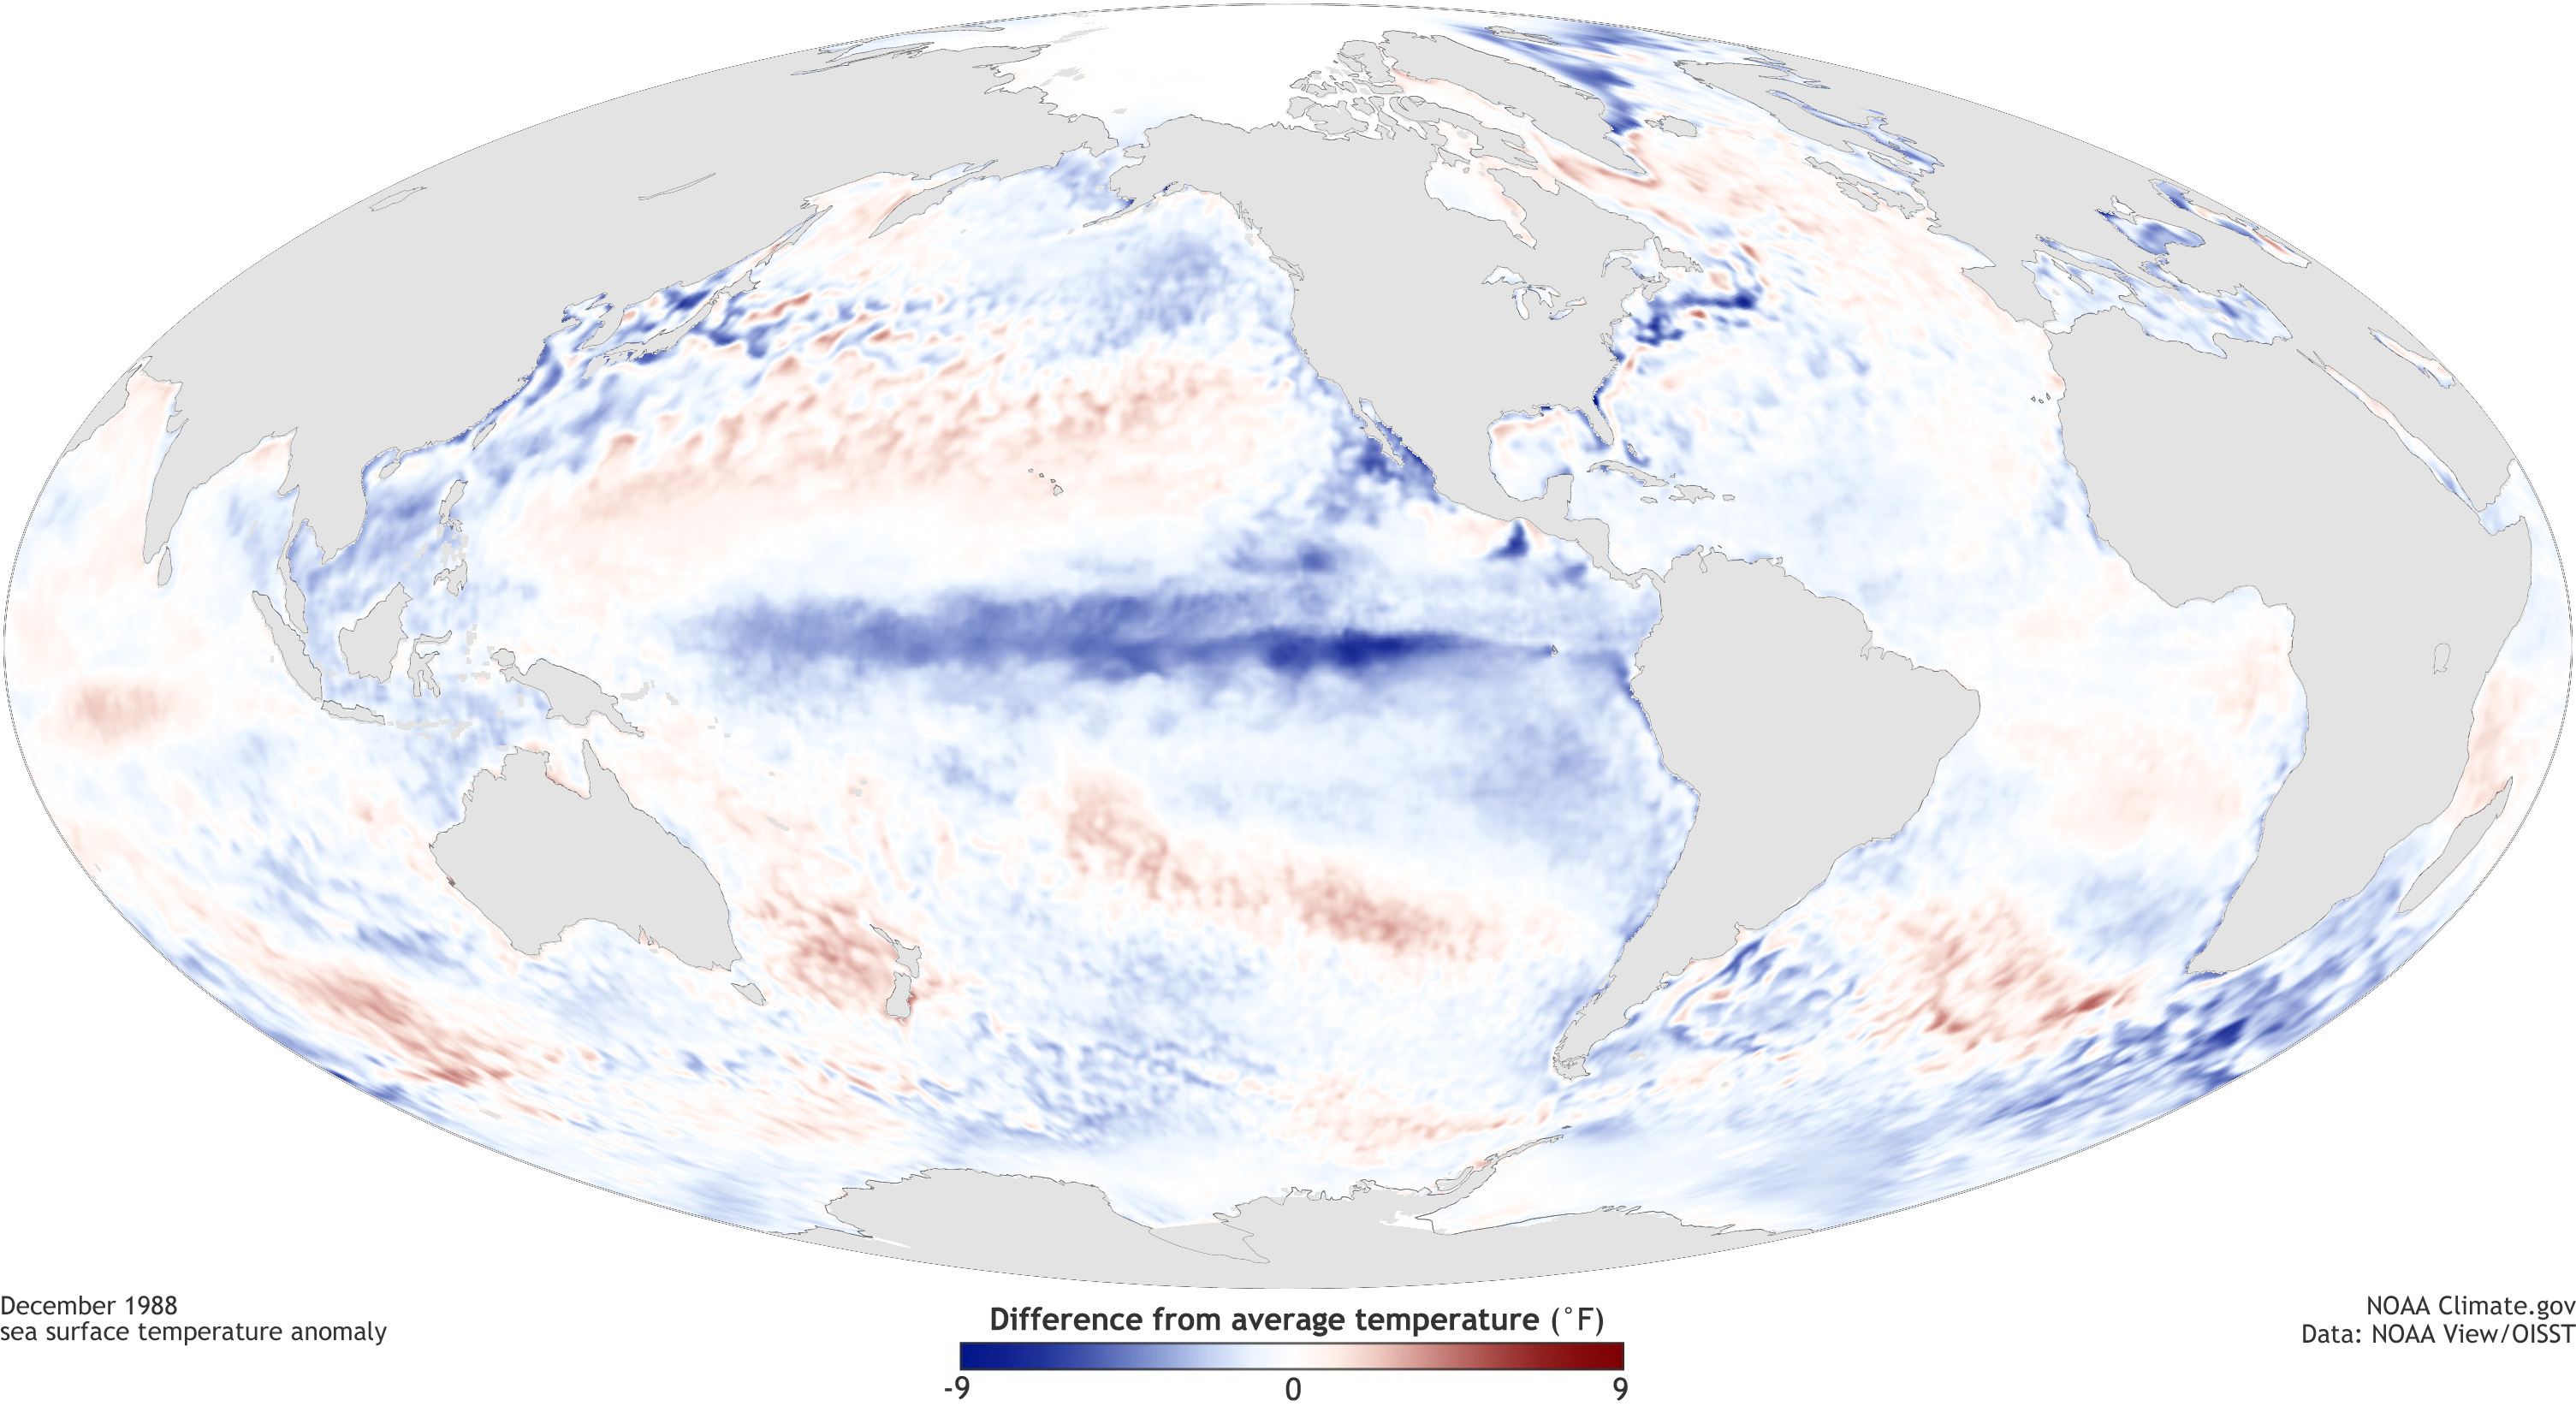
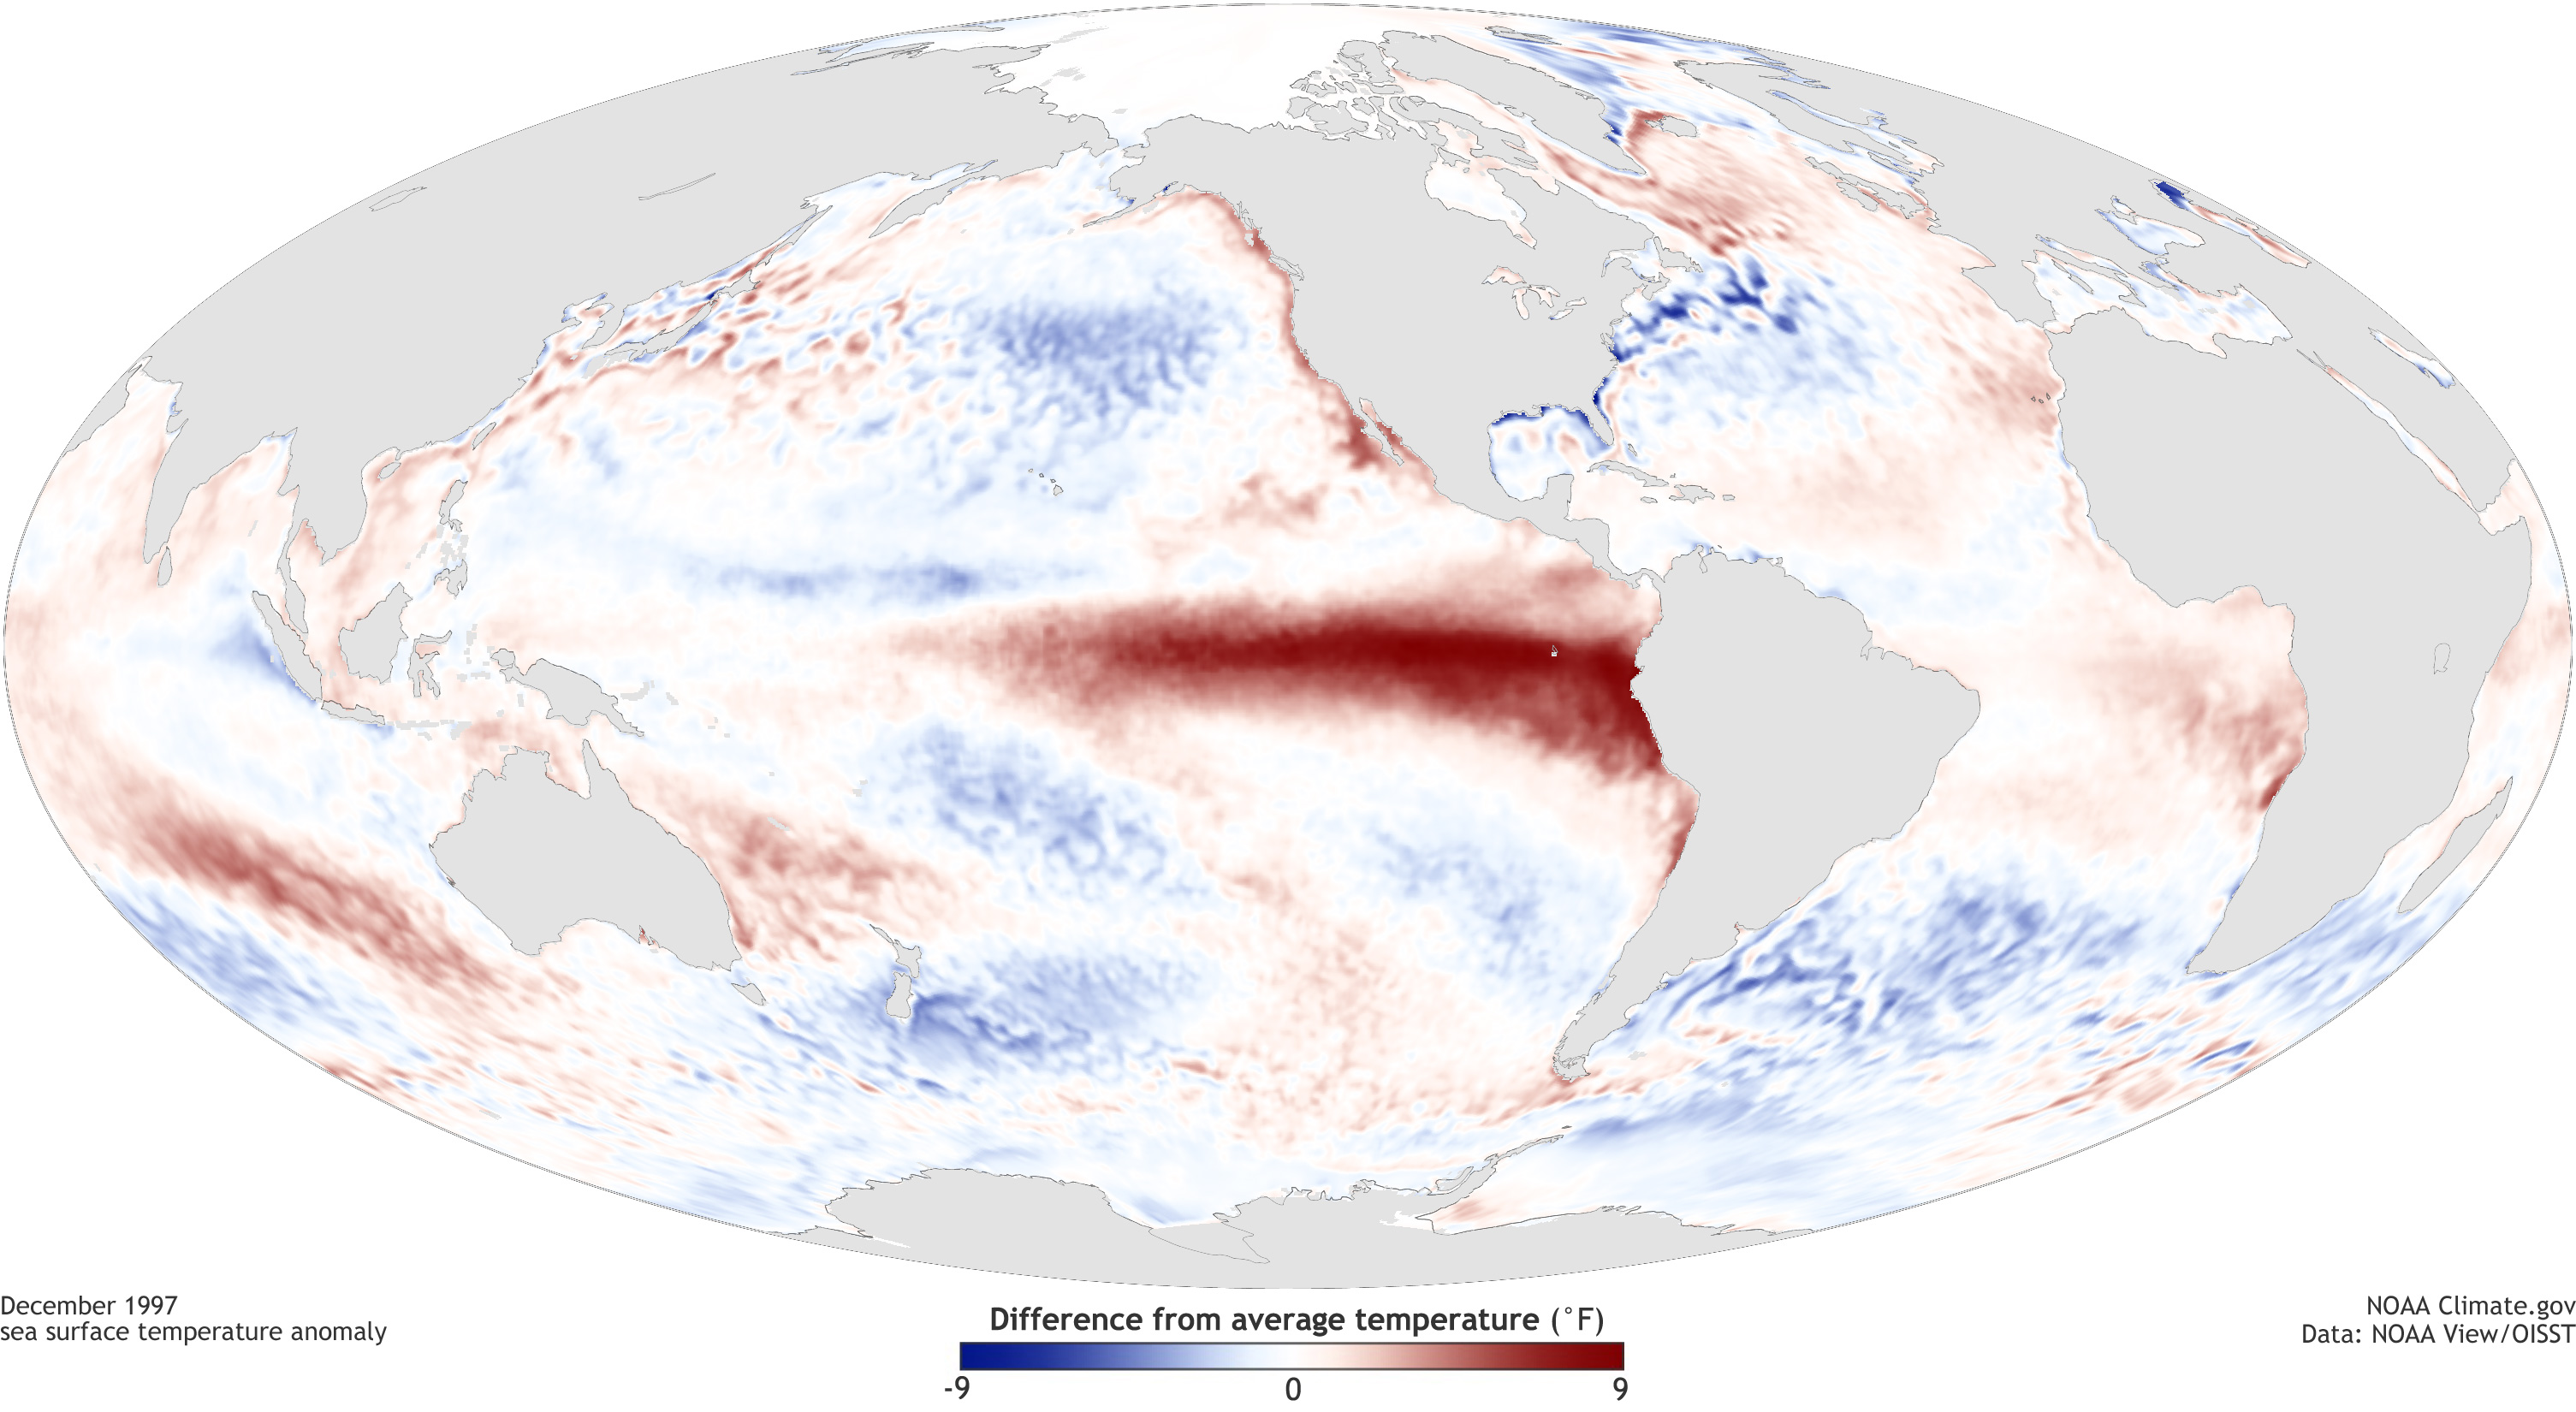
Maps of sea surface temperature anomaly in the Pacific Ocean during a strong La Niña (top, December 1988) and El Niño (bottom, December 1997). Maps by NOAA Climate.gov, based on data provided by NOAA View. large versions La Niña | El Niño
So, by now, you might have noticed that while “ENSO” is a nice catchall acronym for all three states, that acronym doesn’t actually have the word La Niña in it. Why is that? Well, that is a fluke of history. Before La Niña was even recognized, South American fisherman noticed the warm up of coastal waters occurred every so often around Christmas. They referred to the warming as “El Niño,” (niño being Spanish for a boy child) in connection with the religious holiday.
Sir Gilbert Walker discovered the “Southern Oscillation,” or large-scale changes in sea level pressure across Indonesia and the tropical Pacific. However, he did not recognize that it was linked to changes in the Pacific Ocean or El Niño. It wasn’t until the late 1960s that Jacob Bjerknes and others realized that the changes in the ocean and the atmosphere were connected and the hybrid term “ENSO” was born. It wasn’t until the 1980s or later that the terms La Niña and Neutral gained prominence.
In future updates, we will spend more time describing ENSO and how it is defined and tracked, but if you can’t wait, you can read more here now.
But, if you just want to keep things simple, then watch Chris Farley play El Niño on Saturday Night Live.
Comments
Congratulations
RE: Congratulations
average ocean temperatures
Re: Average Ocean Temperatures
One of our scienitsts will have to weigh in on the second part of your question, but regarding part 1, we did an article on the subject of how global warming has forced NOAA to re-define what counts as "average" for the purpose of monitoring El Niño.
http://www.climate.gov/news-features/understanding-climate/watching-el-…
RE: Re: Average Ocean Temperatures
RE: RE: Re: Average Ocean Temperatures
El Nino graphics
And, why this stroNg EL NINO, this year?
RE
ElNino in a nutshell by Michelle L'Heureux .
Quick Question
RE: Quick Question
First, did you mean El Nino or La Nina? In either case, the answer is probably not much, at least directly. But if either one of them indirectly causes populations to migrate more, as might also be the case for general climate change, then there could be an exacerbating effect on incidence of swine flu.
Appreciation
Research on ENSO
El Nino of 1997
RE: El Nino of 1997
Very cool! Thanks for sharing.
Predicting ENSO
RE: Predicting ENSO
Hi, I'm not sure what you mean by poor accuracy... can you give an example? We measure the accuracy of our forecasts in several different ways, so I might be able to comment on it if you can give me insight into which event you were looking at. For example, I consider our forecasts of the recent 2015-16 El Nino and subsequent 2016-17 La Nina to be pretty good in the sense that we knew the wintertime state of ENSO ~6 months in advance. For the most recent 2017-18 La Nina we issued a La Nina watch (possibly arrival of La Nina) in September 2017 and then declared its onset in November 2017.
RE: RE: Predicting ENSO
RE: RE: Predicting ENSO
RE: RE: RE: Predicting ENSO
It sounds like there is a difference of opinion on when "early" is. It is well known that forecasts made in the spring for ENSO have less skill then those afterwards. This is known as the Spring Predictability Barrier which we have written about here . So we know that forecasts made during that period are not as good. (Plus as a note, the forecast you showed above in your link is a model-only forecast and not the human based forecasts that are issued at the beginning of every month). So I'd recommend looking at forecasts after that period, which would still be 6 months before the upcoming winter.
Of course, the other issue when determining how good a forecast is, is that our forecasts are probabilistic in nature. These sorts of forecasts need many events in order to see just how good they are. After all, if we issue a forecast of a 60% chance of El Nino and a 25% of La Nina by DJF and it ends up being a La Nina, is that wrong? That is supposed to happen 25% of the time.
Strengths of Argument: Man-made vs ENSO?
Best and most accurate info
Thanks!
Thank you
How does it happen?
RE: How does it happen?
Not a dumb question at all. I suspect you'll understand the phenomenon better by following our ENSO blog updates (2x a month)... this month (October 2020) we will have a post on the Bjerknes feedback which should hopefully give some more clarity on why ENSO exists.
ENSO vs ELSOLA
meteo topics in clil methodology
Interesting, I've suggested this topic to my students at Istituto Tecnico Nautico "F.Caracciolo" -Bari. Thanks!
The cause of the water warming?
Is it true that underwater fault lines and subsequent volcanic activity is the reason the water temperature rises in the south pacific? The amount of magma that is released at the bottom of the ocean, is occasionally, so vast, that it is comparable to what occurs when you place a pot of water on a stove burner ? And if so why is this rarely mentioned in these types of discussions?
Undersea volanoes not causing ocean warming
Hi Robert. The reason you don't hear much about it is that underwater volcanic activity does not heat the surface waters of the global ocean. We know this through several lines of evidence, the simplest being that the ocean gets colder the deeper it gets. If underwater eruptions or volcanic vents provided significant heat to the ocean, bottom waters would be hotter than the surface, but they aren't, as any diver will tell you.
And if increases in underwater volcanic activity were causing global warming, then we would expect that the deepest waters would be warming fastest and the rate of warming would get weaker the farther you get from the ocean bottom. Instead, it's the opposite: the rate of warming is fastest as the surface and slower the deeper you go. This proves that the cause of the warming is something at the surface, not at the bottom.
We haven't updated this graphic since 2019, but it clearly shows you waht I am talking about:
https://www.climate.gov/media/13056
The colored lines show the amount of heat build up at different depths. The most heating is at the surface; the least is in the abyss.
Heat Rises
I’m not a scientist but my observation is that heat rises. So the hot water being produced at the bottom of the ocean (from volcanic activity) would rise to the surface thus increasing the temperature. The more volcanic activity the more heat transfers to the water which eventually rises to the surface. Just like a pot on a stove. Thanks
In response to heat transfer
I am not a scientist but the way thermodynamics works is that hot usually always seeks cold, not the other way around. Heat is always trying to radiate to the atmosphere. Some things act as heat sinks but that is another issue. To hopefully answer you, if volcanic activity were to warm the ocean, the nearest depths would heat first, or absorb the heat since they are colder than magma. Now if, say, 100 meters of ocean above the volcanic activity warmed, the ocean above that would be colder. Now the the slightly warmer layer transfers that heat to the water above. So on and so forth. By the time the heat reaches the surface it would be dissipated in theory. Unless the source of heat is way way hotter than a volcanic vent and massive.
hope this helps.
Great illustrations
The illustrations and descriptions helped me understand this a lot.. Thank you!!
Strange weather
We have had MULTIPLE hail storms, damaging winds, and heavy downpours recently. I witnesses 4 different heavy hail storms in the same location in the Mississippi Delta over a period of 7 hours—never in my life have I seen this. Very strange weather days indeed.
unbelievable weather!!!!
I too have witnessed first hand these horrible terrors of weather. my car windscreen was smashed in the heavy hail... worst of all my cat was walking in it.L7
thank you!
Well explained, I appreciate the clear explanation.
Thank You
Wonderful
nice job good explaination
nice job good explaination
Comments have been disabled on this article