August 2015 El Niño update: Supercalifragilisticexpealidocious
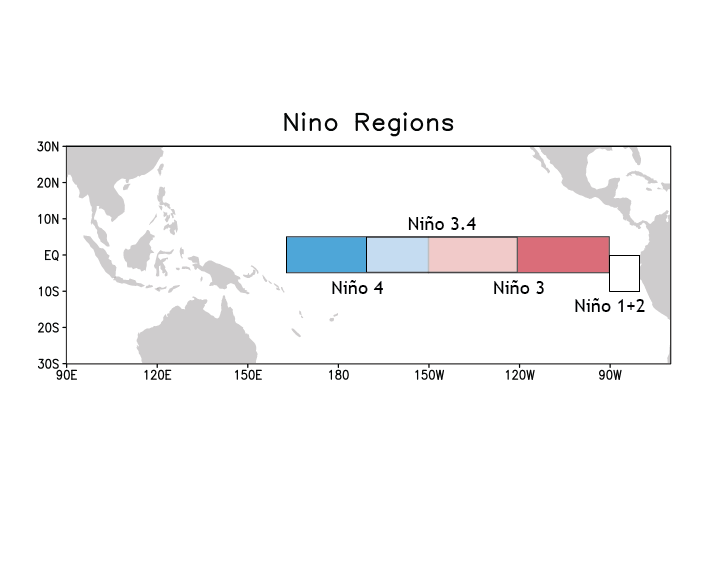
As of August, NOAA and IRI forecasters are predicting this El Niño will peak in the late fall/early winter with 3-month-average sea surface temperatures in the Niño3.4 region near or exceeding 2.0°C (3.6°F) above normal. If this forecast comes true, it will place the 2015 event among the strongest El Niños in the (admittedly short) 1950-2015 historical record. What would this mean for expected impacts in the United States?
But first, this status update!
Sea surface temperature anomalies (departures from the long-term average) increased in much of the equatorial Pacific during July. The July average in the Niño3.4 region was +1.2°C above normal according to the ERSST monitoring datasets. The atmospheric features observed in the equatorial Pacific region during July show that the El Niño ocean-atmosphere coupling is cranking along: easterly winds near the surface were consistently weaker than normal, as were the westerly winds in the upper levels of the atmosphere, and satellites saw more clouds than average in the central and eastern Pacific.
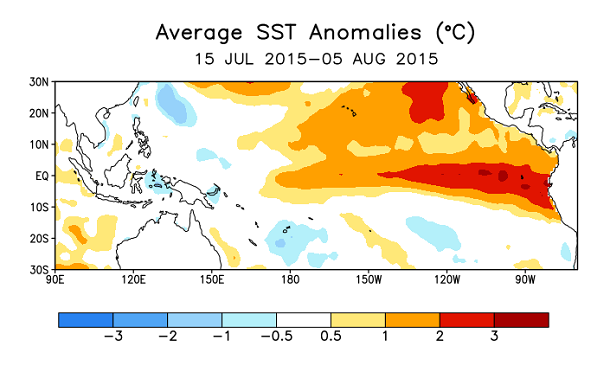
Sea surface temperatures in the tropical Pacific: departure from the 1981-2010 average. CPC image.
The atmospheric response provides not just evidence that El Niño is strengthening, but confidence that it will continue to develop because the weakened near-surface easterly winds allow the surface waters to warm. Another near-surface westerly wind burst occurred in the western Pacific in late July, which will probably further reinforce the reservoir of warmer subsurface waters. The strongest El Niño events have all had very consistent near-surface wind anomalies across the tropical Pacific that lasted through the summer and fall.
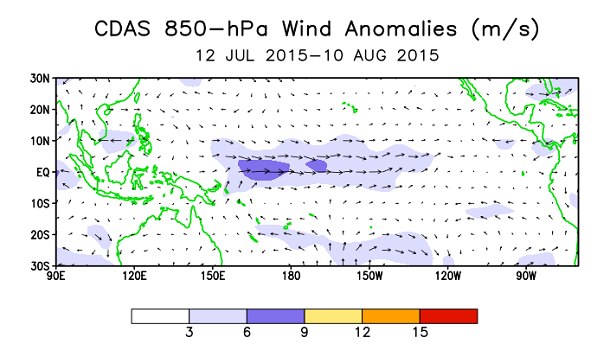
Recent average winds near the surface of the tropical Pacific: departure from the 30-year average. Purple shading area indicates where the normally easterly (blowing from east to west) winds are weaker than normal. CPC image.
How much does strength matter to El Niño impacts?
El Niño is a climate pattern located in the tropical Pacific, so it doesn’t affect U.S. weather directly. Rather, it changes the larger-scale flow or circulation of the atmosphere. Warmer tropical Pacific waters release more heat to the atmosphere, causing more rising air and storminess in the central and eastern tropics. The rising air moves north (and south) away from the tropics, traveling to the mid-latitudes, where it shifts the North Pacific jet stream farther southward and eastward. Movement and extension of the jet stream can bring more storms to the United States, and change the seasonal temperature and precipitation patterns. For a great explanation of the way this works, check out Tony’s post.
The point of mentioning this is that there are a lot of complex mechanics behind how El Niño affects U. S. weather. There is a domino effect that arises from the warmer surface waters in the tropical Pacific, and small changes in how later dominos fall can ultimately determine exactly what will happen over the U.S. While we have more confidence in general impacts over the U.S. in an El Niño because of the shifts in the jet stream, they’re not guaranteed, because the ultimate result will also depend on factors (chaos & other climate patterns) that are not predictable months in advance and can also impact the jet stream and large scale atmospheric flow.
This is why we keep saying that El Niño “tilts the odds” for weather and climate impacts. For example, in any random non-ENSO year, the chances that southern California will receive above- normal, near-normal, or below-normal rainfall in winter (December – February) are equal: 33.3% above normal, 33.3% near normal, and 33.3% below normal. During a strong El Niño year, these odds might shift to, say, 60% chance of above, 30% chance of near normal, and 10% chance of below. (This is just an example, not an official forecast!)
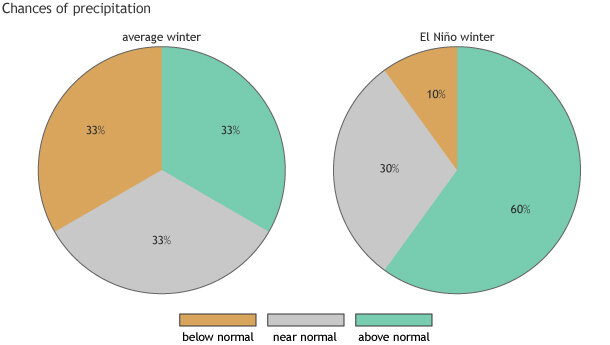
An example of how a strong El Niño could shift the odds for the amount of seasonal precipitation. Official outlooks from the Climate Prediction Center are available here.
In other words, even a strong El Niño is not a sure-fire drought-buster for California (Tom wrote about this last year; and Mike covered it as well), so it’s not time to stop conserving water, especially given how entrenched this drought is (i.e. it will likely take more than one good year to erase). However, a strong El Niño does increase the chance of more precipitation overall during the winter, and also brings the potential for extreme rainfall. This may help alleviate the drought, but also can also lead to mudslides and flooding.
So at the Climate Prediction Center we’re not spending a lot of time debating about if El Niño Bruce Lee will be the strongest El Niño in history, or the second-strongest, or the third, etc. A strong event increases the probability that the U.S. will experience weather and climate impacts, but the strength of the event does not map directly on to the strength of the impacts.
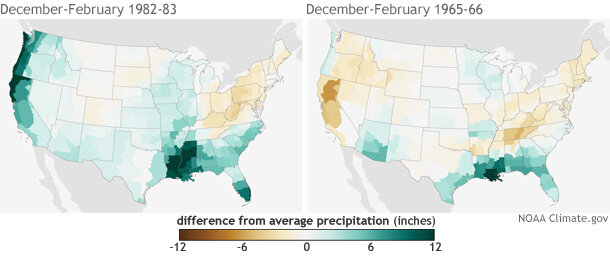
Winter precipitation (December-February) in 1982-83 and 1965-66—two strong El Niño events—compared to the 1981-2010 average. The winter of 1982-83 showed the "classic" wet signal that El Niño often brings to California, but the winter of 1965-66 did not. Maps by NOAA Climate.gov, based on NCEI climate division data provided by the Physical Sciences Division at NOAA ESRL.
We have a relatively confident forecast for a strong event, and this provides long-range forecasters with information they can use to develop their seasonal forecasts. So, although there are no guarantees, the odds nonetheless really are tilted in specific directions in various parts of the U.S. as far as winter climate is concerned. A significant El Nino like this one provides an uncommon opportunity for people to anticipate the climate tendency well in advance of the main impact season.
Comments
2015 El Nino implications
RE: 2015 El Nino implications
The latest state-of-the-art models are run with global sea surface temperatures (including Blob and warm Indian ocean) and most of them are still providing El Nino-like impacts over the United States. Because the models include these features, at this point, we are not projecting that the Blob and warm Indian Ocean would substantially disrupt the El Nino signal. Of course, keep in mind this winter could also be influenced by other, less predictable features like the AO/NAO and PNA. El Nino only allows forecasters to potentially "explain" a certain amount of rainfall or temperature variability, which is why we never guarantee these impacts.
Earlier on this blog, we posted an article by Dennis Hartmann ( LINK ) who discussed a possible tropical Pacific link with the Ridiculously Reslient Ridge (RRR) over the U.S. The tropics now have a very different pattern because of El Nino and, so as a result, it is more likely that the the RRR will weaken as we get into the winter.
Baja Blob
RE: Baja Blob and ENSO
Will Silicon Valley see rain this year?
RE: Will Silicon Valley see rain this year?
For more local impacts, you might consider seeking out your local NWS office for more specific information. At CPC there is a collection of large-scale El Nino impacts and diagrams which you can review by clicking HERE (though please note the box and whisker links are more regionally focused).
Also, you can access the CPC seasonal temperature and precipitation outlooks HERE . These are updated on the third Thursday of every month. At this time, there is a very slight tilt toward above-average precpitation for the Bay area, but this may change as we move closer to the event. Also keep in mind these maps show shading that reflects probabilities (% chance of) of the *favored* category, so there are still chances for near or below average precpitation.
Rainy season
Rainfall Patterns
How will the warm water in
A few concerns...
RE: A few concerns...
RE: RE: A few concerns...
RE: RE: RE: A few concerns...
To answer your last question first, you can check out the monthly Equatorial Southern Oscillation numbers here or any other numer of indices here.
As for the SST indices, we use the ERSSTv4 for verification and classification purposes (and you can find it in the list of indices at the second link above) which come out once a month. Other SST datasets like the OISST come out every week in addition to monthly and seasonal values. Both use different processes to determine sea surface temperatures which accounts for their differences in Nino3.4 values. ERSSTv4 has a longer record which allows for better comparison to previous events. OISST only goes back to 1981 while ERSSTv4 goes back to 1950.
If you average the monthly ERSSTv4 values, they will equal the seasonal 3-month averages as well.
1957-58
RE: 1957-58
Thanks for your question. The 65/66 and 82/83 maps were lifted out of the second graphic in this previous blog post (https://www.climate.gov/news-features/blogs/enso/united-states-el-ni%C3…). That graphic includes all El Niño events of the past 50 years, including the 57/58 that you mention. For this article, we lifted out two strong events with opposite precipitation anomalies becuase we wanted to emphasize the point that in any given year--even a strong El Niño--other random climate influences can overrule the classic wet signal.
If you look at that graphic, it shows that out of the 7 strong events that have occurred since 1950, 6 of them led to wetter than average winters of various magnitudes in CA. But in 65/66, despite the strong El Niño, CA was drier than average. El Niño is about increased probability, not certianty. That was the main point we were tring to convey by only showing the two examples.
I'm not one of the scienitsts blogging here, simply the editor, but i know from previous blog posts that while "analog" forecasting--trying to predict what will happen based on seeimingly similar past events--isn't completely meaningless, it's usefulness has significant constraints. Even seemingly insignificant differences between one event and another can allow the climate system to evolve along two radically different pathways, leading to different outcomes.
And statististically speaking, when you try to pull out a single year as being "most like" the current conditions and try to infer the future based heavily on that one case, you're essentially trying to draw statistical inferences from a sample size of 1. It would be like trying to infer what all dogs look like based on having seen a single dog.
ENSO maps
RE: ENSO maps
Thanks for your comment. It's one we hear a lot in a variety of contexts. Unfortuantely, your state's vastness, wildness, and low population density go hand in hand with a sparse observational record that makes it much harder to describe historical climate patterns statewide. However, in a blog from last year, MIke Halpert answered a similar question with the following response:
There isn't a well defined precipitation signal over Alaska in any case. However, winters are typically warmer than average over large parts of the state during El Nino years.
New England
RE: New England
Not necessarily. For the latest winter season forecasts, please check out the Climate Prediction Center's seasonal forecast page . For the December-February period, their is no clear indication that conditions are favored to be average, above, or below-normal this winter so there is an equal chance of all three.
Impact of the major July WWB
Effects in Europe
El Nino and the Western Caribbean
ENSO and Madden-Julian Oscillation
RE: ENSO and Madden-Julian Oscillation
The MJO indeed can have a reinforcment/cancellation effect on an El Nino event. For a great intro on the MJO, check out this guest post on the ENSO Blog by Jon Gottschalck.
Depending on where the rising and sinking sections of an MJO event are located, they can be associated with an enhancement or suppression of the trade winds. In some cases, an MJO could enhance the trade winds which would be the exact opposite of what you would expect from an El Nino. Or vice versa.
Midwest
RE: Midwest
For the latest winter season forecasts, please check out the Climate Prediction Center's seasonal forecast page . For the December-February period, the latest forecast shows a tilt in the odds to warmer than average conditions for the north central portion of the UNited states with an equal chance for above, below or average conditions across the central US.
Possible El Nino 2015 effect on Phoenix AZ winter months
RE: Possible El Nino 2015 effect on Phoenix AZ winter months
For the latest winter season forecasts, please check out the Climate Prediction Center's seasonal forecast page . For the December-February period, the latest forecast shows a small tilt in the odds to wetter than average conditions for the Phoenix area.
S E Trades
Strong el Nino and colorado
When Will 2015 - 2016 Godzilla El Niño Hit The Pacific Northwest
RE: When Will Godzilla El Niño Hit The Pacific Northwest
Thanks for writing. Keep in mind first that "godzilla" or not, El Niño and La Niña are not like a hurricane or major winter storm that will "hit" the West Coast. It's a disruption of the typical temperature and wind circulation across the tropical Pacific, and the side effects are felt "downstream" in the atmosphere. It's like a tree falling across a creek way upstream of where you live. The tree doesn't hit you, but the flow past your house may be stronger or weaker, depending on how the tree blocks the creek's usual course.
That said, based on everything I've learned by editing this blog in the past year, in the US, the impacts of El Niño and La Niña are felt most strongly in the winter, but again the influence is not like the arrival of a hurricane or any other individual weather event. Rather, the influence shows up on the seasonal average temperatures and precipitation.
Supercalifragilisticexpealidocious
Supercalifragilisticexp*I*alidocious
hawaii
No One Hasn't Gave Me An To My Question To When Super El Niño
No One Hasn't Gave Me An To My Question
Aside from its influence on the Eastern Pacific hurricane season, El Niño and La Niña have little detectable influence on summer climate across the U.S. Instead, their influence is strongest in winter.
Bear in mind, though, that the influence often won't be detectable until winter is over and scienitsts can tally up the seasonal averages. For places that tend to have wetter winters during El Niño, that elevated wetness can be the result of say, a handful more rainy days per month than usual, or somehwat more rain per storm than usual. It doesn't result from the "arrival" of a single mega-rainstorm of some kind.
In other words, El Niño is not a discrete event like a hurricane or a tsunami that will "arrive" or "hit" the West Coast at a single moment in time. You don't need to "head for the hills" to escape it ;-)
As far as the descriptions of the event as "Super El Niño" or even "Godzilla El Niño," I hope you recognize that those are not scientific or official descriptions. They are coloful, memorable phrases that various folks have used informally to talk about this event. As Emily writes above, the current forecasts predict that the sea surface temperature anomaly in the tropical Pacific "ENSO3.4" monitoring region will peak this winter at 2C. Should that come to pass, it will be among the largest El Niño-related temperature anomalies on record, but it wouldn't be the largest: it would be weaker than both the 1997-98 and 1982-83 events. (You can see for yourself here:
http://www.cpc.ncep.noaa.gov/products/analysis_monitoring/ensostuff/ens…)
Galapagos
THANK YOU REBECCA LINDSY FOR YOU ON SUPER EL NIÑO 2015-16 GODZIL
THANK YOU REBECCA LINDSY FOR YOU ON SUPER EL NIÑO 2015-16 GODZIL
Why does El Nino peak during winter?
El Nino scenarios
RE: El Nino scenarios
Hi Ismael, I would recommend visiting the Pacific ENSO Applications Climate Center (PEAC) for seaonal rainfall and sea level forecasts for islands in the Pacific.
RE: El Nino scenarios
RE: RE: El Nino scenarios
Thanks for weighing in here Jessica!
Galapagos and El Nino
El Nino 2015 Effect On florida weather
beachfront seawalls
Why does El Nino peak during winter?
Comments have been disabled on this article