What is the MJO, and why do we care?
The articles posted on this blog have described ENSO, its regional and global impacts, and the challenge of forecasting it, among several other topics. Here we introduce another important player on the tropical stage: the Madden-Julian Oscillation, or MJO. While the MJO is a lesser-known phenomenon, it can have dramatic impacts in the mid-latitudes. Several times a year the MJO is a strong contributor to various extreme events in the United States, including Arctic air outbreaks during the winter months across the central and eastern portions of the United States.
So what is the MJO?
Imagine ENSO as a person riding a stationary exercise bike in the middle of a stage all day long. His unchanging location is associated with the persistent changes in tropical rainfall and winds that we have previously described as being linked to ENSO. Now imagine another bike rider entering the stage on the left and pedaling slowly across the stage, passing the stationary bike (ENSO), and exiting the stage at the right. This bike rider we will call the MJO and he/she may cross the stage from left to right several times during the show.
So, unlike ENSO, which is stationary, the MJO is an eastward moving disturbance of clouds, rainfall, winds, and pressure that traverses the planet in the tropics and returns to its initial starting point in 30 to 60 days, on average. This atmospheric disturbance is distinct from ENSO, which once established, is associated with persistent features that last several seasons or longer over the Pacific Ocean basin. There can be multiple MJO events within a season, and so the MJO is best described as intraseasonal tropical climate variability (i.e. varies on a week-to-week basis).
The MJO was first discovered in the early 1970s by Dr. Roland Madden and Dr. Paul Julian when they were studying tropical wind and pressure patterns. They often noticed regular oscillations in winds (as defined from departures from average) between Singapore and Canton Island in the west central equatorial Pacific (Madden and Julian, 1971; 1972; Zhang, 2005).
The MJO consists of two parts, or phases: one is the enhanced rainfall (or convective) phase and the other is the suppressed rainfall phase. Strong MJO activity often dissects the planet into halves: one half within the enhanced convective phase and the other half in the suppressed convective phase. These two phases produce opposite changes in clouds and rainfall and this entire dipole (i.e., having two main opposing centers of action) propagates eastward. The location of the convective phases are often grouped into geographically based stages that climate scientists number 1-8 as shown in Figure 1.
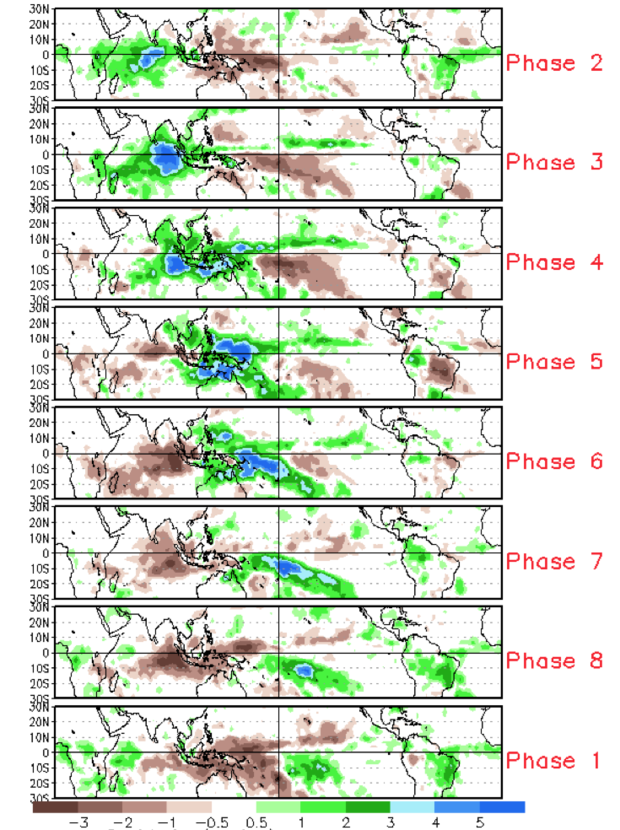
Figure 1: Difference from average rainfall for all MJO events from 1979-2012 for November-March for the eight phases described in the text. The green shading denotes above-average rainfall, and the brown shading shows below-average rainfall. To first order, the green shading areas correspond to the extent of the enhanced convective phase of the MJO and the brown shading areas correspond to the extent of the suppressed convective phase of the MJO. Note eastward shifting of shaded areas with each successive numbered phase as you view the figure from top to bottom.
For the MJO to be considered active, this dipole of enhanced/suppressed convective phases must be present and shifting eastward with time. An animated illustration that depicts the global scale and eastward propagation of these two phases of the MJO is shown here (Fig. 2: animation).
Figure 2. An animation illustrating the organization of the MJO into its enhanced and suppressed convective phases during an MJO event during the spring of 2005. The green shading denotes conditions favorable for large-scale enhanced rainfall, and the brown shading shows conditions unfavorable for rainfall. The MJO becomes organized during late March through May as the green shading covers one half of the planet, and brown shades the other half all along as these areas move west to east with time. Notice how the shading returns to the same location on the order of about 45 days.
What’s behind the pattern?
Let’s dig a little deeper and look at some of the characteristics within these two convective phases (Figure 3). In the enhanced convective phase, winds at the surface converge, and air is pushed up throughout the atmosphere. At the top of the atmosphere, the winds reverse (i.e., diverge). Such rising air motion in the atmosphere tends to increase condensation and rainfall.
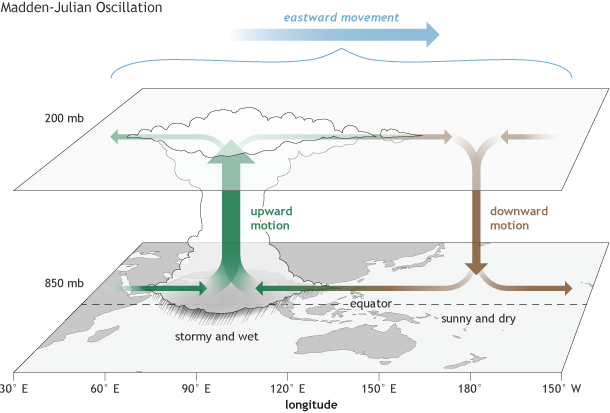
The surface and upper-atmosphere structure of the MJO for a period when the enhanced convective phase (thunderstorm cloud) is centered across the Indian Ocean and the suppressed convective phase is centered over the west-central Pacific Ocean. Horizontal arrows pointing left represent wind departures from average that are easterly, and arrows pointing right represent wind departures from average that are westerly. The entire system shifts eastward over time, eventually circling the globe and returning to its point of origin. Climate.gov drawing by Fiona Martin.
In the suppressed convective phase, winds converge at the top of the atmosphere, forcing air to sink and, later, to diverge at the surface (Rui and Wang, 1990). As air sinks from high altitudes, it warms and dries, which suppresses rainfall.
It is this entire dipole structure, illustrated in Figure 3, that moves west to east with time in the Tropics, causing more cloudiness, rainfall, and even storminess in the enhanced convective phase, and more sunshine and dryness in the suppressed convective phase.
The changes in rainfall and winds described above impact both the Tropics and the Extratropics, which makes the MJO important for extended-range weather and climate prediction over the U.S. and many other areas. The MJO can modulate the timing and strength of monsoons (e.g., Jones and Carvalho, 2002; Lavender and Matthews, 2009), influence tropical cyclone numbers and strength in nearly all ocean basins (e.g., Maloney and Hartmann, 2000), and result in jet stream changes that can lead to cold air outbreaks, extreme heat events, and flooding rains over the United States and North America (Higgins et al. 2000, Cassou, 2008, Lin et al. 2009, Zhou et al., 2012, Riddle et al., 2013, Johnson et al., 2014).
The MJO can produce impacts similar to those of ENSO, but which appear only in weekly averages before changing, rather than persisting and therefore appearing in seasonal averages as is the case for ENSO.
Future posts will focus on the details of how we monitor and assess the strength of the MJO, provide details on impacts and the reasons for those impacts, and describe the current state of MJO predictability. Realtime MJO information that is updated daily or weekly can be found on the NOAA CPC MJO webpage.
References
Madden R. and P. Julian, 1971: Detection of a 40-50 day oscillation in the zonal wind in the tropical Pacific, J. Atmos. Sci., 28, 702-708.
Madden R. and P. Julian, 1972: Description of global-scale circulation cells in the tropics with a 40-50 day period. J. Atmos. Sci., 29, 1109-1123.
Cassou, C., 2008: Intraseasonal interaction between the Madden Julian Oscillation and the North Atlantic Oscillation. Nature, 455, 523-527 doi:10.1038/nature07286 Letter
Higgins, W., J. Schemm, W. Shi, and A. Leetmaa, 2000: Extreme precipitation events in the western United States related to tropical forcing. J. Climate, 13, 793-820.
Nathaniel C. Johnson, Dan C. Collins, Steven B. Feldstein, Michelle L. L’Heureux, and Emily E. Riddle, 2014: Skillful Wintertime North American Temperature Forecasts out to 4 Weeks Based on the State of ENSO and the MJO*. Wea. Forecasting, 29, 23–38.
Jones, C. and L. Carvalho, 2002: Active and Break phases in the South American Monsoon System. J. Climate, 15, 905-914.
Lavender, S. and A. Matthews, 2009: Response of the West African monsoon to the Madden-Julian Oscillation, J. Climate, 22, 4097-4116.
Maloney E. and D. Hartmann, 2000: Modulation of hurricane activity in the Gulf of Mexico by the Madden-Julian Oscillation. Science, 287, 2002-2004.
Riddle, E. E., M. B. Stoner, N. C. Johnson, M. L. L’Heureux, D. C. Collins, and S. B. Feldstein, 2013: The impact of the MJO on clusters of wintertime circulation anomalies over the North American region. Climate Dyn., 40, 1749–1766.
Zhang, C., 2005: Madden-Julian Oscillation. Reviews of Geophysics, 43, 1-36.
Zhou S., M. L’Heureux, S. Weaver, and A. Kumar, 2012: A composite study of MJO influence on the surface air temperature and precipitation over the Continental United States. Climate Dyn., 38, 1459-1471.
Lead reviewer: Anthony Barnston
Comments
I think I understand, more or
RE: I think I understand, more or
From the author of this post, Jon Gottschalck:
"This is a very good question. Perhaps an alternative or better way to answer this question is that we still don't understand why and how the MJO initiates, maintains itself or decays in the manner described here. There are many theories which I won't go into detail here but no one theory completely explains the unique characteristics that we observe with respect to its period, propagation speed or large global scale. An international field campaign centered across the Indian Ocean called DYNAMO (Dynamics of the MJO) took place from October 2011 through March 2012 in which a wealth of data was collected during a period of robust MJO activity. It is hoped that research using this data in coming years will advance the science of why the MJO behaves the way it does."
RE: I think I understand, more or
RE: RE: I think I understand, more or
still don't understand.
RE: still don't understand.
There is no way to predict with much confidence when people will understand why and how the MJO iitiates, maintains itself or decays. Increases in understanding usually occur incrementally and over fairly long periods of time. It might seem like we are stupid, or are not trying hard enough, but that is not the case. The questions are HARD. There are remaining questions about ENSO that are also very difficult. They are as hard as those about why we still don't have a way of preventing the common cold.
Earth's rotation and MJO
MJO and the Hot Blob west of Baja
RE: MJO and the Hot Blob west of Baja
The MJO itself is fairly well constrained to the tropics, although some of its impacts do extend away from the tropics, in both northern and southern hemispheres. The blob is happening in the northern hemisphere, and has been there for a few months. The MJO effects usually follow the MJO itself, progressing from west to east around the globe, unlike the blob which has been relatively stationary. Also, the MJO effects are more easily observed in the atmosphere than the ocean, because it takes longer for the ocean to respond (especially in terms of its surface and subsurface temperature, which mainly define the blob). While there is an effect on the ocean temperature, especially in the tropics, it is not a very large effect because the influence of the MJO keeps changing too quickly. So, the blob is likely mainly related to something other than the MJO, such as the ENSO condition or even the PDO condition preceding its formation. Or, it may not be obviously related to any familiar phenomena and may be "its own thing" to large measure.
RE: RE: MJO and the Hot Blob west of Baja
NIce Discussion and a couple of questions
Direction
MJO impacts over Northeast Brazil (NEB), or Nordeste.
Super El Nino After-effects on the MJO
MJO is measured as an intra
RE: MJO is measured as an intra
Many atmospheric weather phenomena can act as stochastic forcing to ENSO. The most effective one is strong episodes of surface westerly wind, often referred to as westerly wind bursts (WWB) or westerly wind events (WWE). The strongest, long-lasting and eastward moving equatorial WWE are mostly associated with the MJO. Many observations have shown anomalously strong MJO activities prior to and during the onset of ENSO warm events. Numerous journal articles explore in greater detail the relationship between ENSO and the MJO.
RE: RE: MJO is measured as an intra
correlation plots
MJO is whatever you say it is
RE: MJO is whatever you say it is
The ENSO bloggers have a limited amount of time they can devote to moderating comments. This means they are committed to handling questions and comments on posts for a week or so after they are initially published, but not in perpetuity. Comments may be approved and published in case other readers want to have a discussion, but you're unlikely to hear from one of the experts on a post this old. Note that I did see your other comment about there being a frame out of order in the animated gif, and I was able to find the file and correct it.
June 12 doesn't come between May 8 and May 13
Abeqas questions on Figure 1
MJO
RE: MJO
ENSO ?
RE: ENSO ?
mjo phase diagram
RE: mjo phase diagram
Hi Ali,
So the mjo has 8 phases correlating to that diagram. Think of them as almost locations. When the MJO enters those phases, it can mean different impacts on weather/climate across the globe including the US.
Commencement of MJO
RE: Commencement of MJO
In our experience the MJO can start from anywhere, though deep convection is not evident over land masses like Africa... the convective part becomes more prominent as the wave transverses the Indian Ocean and Indonesia b/c the ocean is a source of heat/moisture.
RE: RE: Commencement of MJO
RE: RE: RE: Commencement of MJO
When the MJO is in the inner circle of the RMM that means that the MJO signal is not strong or is nonexistent. Other climate phenomena can also show up on that diagram that can give the impression that the MJO is going backwards or forwards or any which way, but doesn't necessarily mean that what is being seen is an MJO.
Direction of MJO propagation
what is the reason for the eastward propagation of MJO???
The dynamics of the MJO are…
The dynamics of the MJO are still not completely understood, so there are a lot details that still need to be worked out. But in general, the eastward propagation relates to how the atmospheric circulation responds to the anomalies of atmospheric convection (the regions of enhanced and suppressed rainfall). Under one framework, the eastward propagation can be understood as a response to the atmospheric Rossby waves forming to the west of the enhanced convection and atmospheric Kelvin waves to the east. The Rossby waves lead to eastward winds while the Kelvin waves lead to westward winds that converge east of the enhanced convection. This converging air rises to the east of the original enhanced convection, leading to new convection and an eastward progression of the whole MJO system.
thank you very much
interesting post
Thanks for the post
thanks, interesting read
Comments have been disabled on this article