Why making El Niño forecasts in the spring is especially anxiety-inducing
Given the relatively high probabilities for El Niño in our team’s April 2023 ENSO update, I decided to team up with some of my scientific colleagues, Antonietta Capotondi (NOAA Physical Sciences Laboratory and University of Colorado, Cooperative Institute for Research in Environmental Sciences) and Aaron Levine (@afzlevine, University of Washington, Cooperative Institute for Climate, Ocean, and Ecosystem Studies), to explain why making ENSO forecasts during the Northern Hemisphere springtime generally makes us want to skip the forecast. But we, of course, cannot because if a decent-sized El Niño is going to form, it is probably going to form in the spring or summer. Which means as much as we’d like to punt on ENSO forecasts in the spring, we have to issue Watches when the tropical Pacific starts pushing in that direction (as we recently did, footnote #1).
This is not the first blog rant post on the lower predictability of springtime ENSO forecasts (here, here, here). And it will probably not be our last! Researchers in the ENSO community are well aware of the forecasting challenges during the spring and are hard at work trying to better understand precursor patterns and fix model biases that may make it easier to predict ENSO in the future.
So, what’s the big deal in the spring? Especially when it comes to predictions of El Niño? It comes down to uncertainty in two of the main ingredients that give rise to El Niño.
- In the spring, it is difficult to know whether surface west-to-east (“westerly”) wind anomalies across the tropical Pacific Ocean will continue through the summer and persist long enough to reinforce the developing El Niño.
- The heat in the subsurface tropical Pacific Ocean is a necessary precursor for El Niño but it is not always sufficient.
Let’s focus on #1 first: the persistence of the surface winds. Dr. Capotondi has published research exploring the relationship of surface winds across the tropical Pacific with ENSO. She used a very detailed satellite-based wind dataset for her analysis and found that the interannual changes in the surface winds are the key ingredient for triggering El Niño (footnote #2). Without persistence of these tropical winds, many El Niño events struggle to achieve lift off and can fizzle. It is this interannual wind variability that determines whether you get a major El Niño (e.g. 1997-98) or an El Niño “bust” (e.g. 2014).
Let’s examine the figures below to visualize this. Starting in March 1997, westerly wind anomalies (warm colors) began to form over the western tropical Pacific Ocean (left panel). In the 1997 case, the interannual variability in the winds (middle panel) was especially strong and long lasting, extending over a year and shifting very gradually eastward with time. A major El Niño event formed and peaked during the 1997-98 winter.
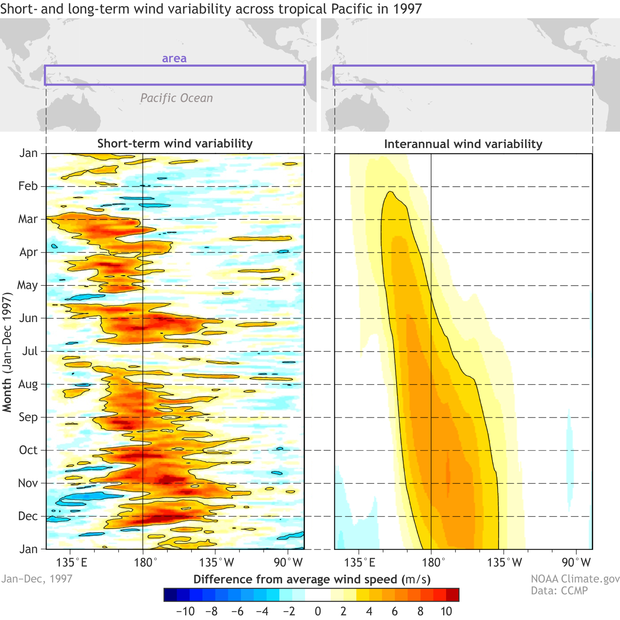
During 1997, the evolution of the surface zonal wind anomalies (in meters per second) along the equatorial Pacific Ocean. Red shading indicates anomalous westerly (from the west) winds, while blue shading denotes anomalous easterly winds. The left panel emphasizes winds that are relatively short-term (the filter isolates periods more than 5 days). The right panel emphasizes the “interannual” winds that are longer-term and more persistent (the filter isolates periods greater than 250 days). On average, the surface winds across the tropical Pacific are easterly, so westerly anomalies—departures from average conditions—can weaken the Walker Circulation. But only if they persist do they lead to El Niño. See Capotondi et al. (2018) for more details on the calculation and data. Figure provided by Antonietta Capotondi and modified by Climate.gov.
Now let’s look at the same period of months during 2014, which, in the spring, was predicted to be a potentially major El Niño event. Right on cue, similar to 1997, the westerly wind anomalies began early in the calendar year and lasted through April (left panel below). However, for some unknown reason, the westerly winds began dissipating and the interannual wind variability was very weak-to-nonexistent for the rest of 2014 (middle panel below).
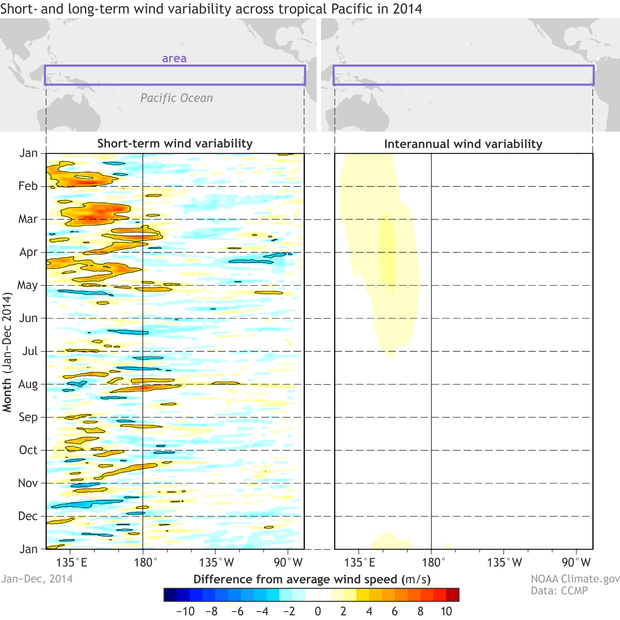
During 2014, the evolution of the surface zonal wind anomalies (in meters per second) along the equatorial Pacific Ocean. Red shading indicates anomalous westerly (from the west) winds, while blue shading denotes anomalous easterly winds. The left panel emphasizes winds that are relatively short-term (the filter isolates periods more than 5 days). The right panel emphasizes the “interannual” winds that are longer-term and more persistent (the filter isolates periods greater than 250 days). On average, the surface winds across the tropical Pacific are easterly, so westerly anomalies—departures from average conditions—can weaken the Walker Circulation. But only if they persist do they lead to El Niño. See Capotondi et al. (2018) for more details on the calculation and data. Figure provided by Antonietta Capotondi and modified by Climate.gov.
Bottom line: if the surface westerly wind anomalies fizzle out and do not continue to recur and intensify throughout the year (the interannual variability), then El Niño can similarly fail to get going. Unfortunately, we can only see this interannual wind variability after the year is over (and we are looking back at the previous year). In the midst of the spring/summer, we do not know whether these winds are random-random or are going-somewhere-random (they are considered mostly forecastable out to 7-10 days). Not ideal, we know.
This brings us to #2: The presence of above-average oceanic heat in the tropical Pacific Ocean. Dr. Levine recently started a 3-year NOAA Climate Program Office (CPO) funded research project on the topic of El Niño false alarms, which are El Niño events that were confidently predicted to happen, but then failed to do so for some mysterious reason. Dr. Levine provided the figure below which displays the many different climate forecasting models that are part of the North American Multi-Model Ensemble (NMME).
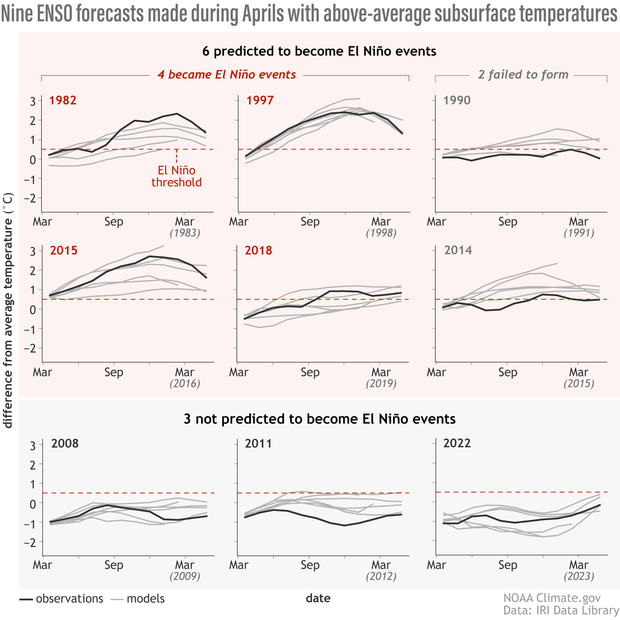
Model forecasts (light gray lines: means from the North American Multi-model Ensemble) and observations (black lines: ERSSTv5 temperature data) of ENSO as measured by the Niño-3.4 index. Years are selected based on the nine largest April values of subsurface warm water volume anomalies (0-500 meters below the surface) of the tropical Pacific Ocean (120E-80W). Subsurface data based on TAO buoys. Figure provided Aaron Levine and modified by Climate.gov.
Each panel in the figure shows 9 different ENSO forecasts made during the month of April. These forecasts all have one major thing in common, which is the presence of above-average temperatures within the subsurface (0-500 meters below the surface) of the tropical Pacific Ocean (footnote #3). The majority, or 6 of the 9 April forecasts, had elevated chances of El Niño events developing later in the year. Another way to express this is that enhanced oceanic heat in the spring can make it more likely an El Niño could form, but it’s not a guarantee either.
Now let’s look closer at those 6 April forecasts that were predicted to become El Niño events (1982, 1990, 1997, 2014, 2015, 2018). Out of that group, 4 of the 6 became El Niño events and 2 failed to form (1990, 2014). Interestingly, of the ones that became El Niño events, the ultimate strength was mostly underestimated, meaning that the El Niños ended up becoming stronger in the winter than the majority of model ensembles predicted in April. So, while bust potential is a risk, there is also limited evidence that models can still be somewhat conservative with forecasting peak intensity!
On the net, while the tropical Pacific precursors of El Niño are currently evident this spring, there is a certain amount of forecast uncertainty that will not go away. Come this summer/fall, we will see whether the conditions we’re seeing this spring were, in fact, sufficient to become a bona fide El Niño (and potentially a significant one). Watch this space.
Footnotes
(1) So, if spring forecasting is such a challenge, then why do the current probabilities seem so high? As Emily laid out in her recent blog post and in the official ENSO discussion, we are currently seeing some of the required precursors of El Niño: (a) recurrence of westery wind anomalies across the equatorial Pacific and (b) emergence of above-average ocean heat content. Morever, many of the state-of-the-art climate models we consider (such as those in the NMME) are providing peak chances of El Niño in excess of 90%. However, because we know the objective model guidance tends to be overconfident this time a year (here and here), the chances in the official outlook are slightly lower (peaking in the mid-80%).
(2) What are these interannual winds? Interannual in our lingo are the “year-to-year” changes. Retrospectively, we can examine the part of the winds that were the most persistent, lasting over a span of at least 8 months (greater than 250 days in this study).
(3) Aaron is examining the 9 cases with the largest April tropical Pacific subsurface ocean heat content anomalies since 1980 via the NOAA PMEL website showing measurements from the TAO buoys.
Comments
Thanks for explaining uncertainties
Thanks for explaining the uncertainty with the El Niño forecast.
When will you have a better idea of whether or not there will be one?
All the uncertainty is…
All the uncertainty is contained in our probabilities that are issued each month (will be updated May 11th):
https://www.cpc.ncep.noaa.gov/products/analysis_monitoring/enso_advisory/ensodisc.shtml
(see Figure 7 for all of probs for each upcoming season).
Clarification
Thanks for the reply, Michelle. That said, my question was more about when the "spring predictability barrier" (as a past ENSO blog entry put it) is expected to clear up (or when it normally clears up)?
Perhaps my question was a bit vague, so I'm clarifying it.
Ah. So generally June…
Ah. So generally June-August is when we start getting more confidence in the winter forecast. But ultimately our probabilities reflect our degree of confidence.
Statistically significant change in la Nina frequency?
Hi Michelle, still appreciating the very informative blog!
I was curious about developments, per your analysis mentioned in an AP article last year, that if the then la Nina extended it would tip the scales to statistical significance for increased frequency of la Ninas over the last 40 years.
https://apnews.com/article/what-is-la-nina-drought-wildfires-hurricanes…
If you're yet to publish something on it I'll understand you not wanting to spill the 3-bean salad, but I'm keen to know if there is any update on this.
Regards,
Barry
We covered the tendency…
We covered the tendency toward La Nina-like changes in this blog article.
https://www.climate.gov/news-features/blogs/how-pattern-trends-across-tropical-pacific-ocean-critical-understanding-future
But keep in mind that the background trend is *small* compared to the natural, season-to-season ENSO fluctuations. Which is why we're now focused on El Nino!
La Nina
Bring back la Nina
ENSO ?
With the possibilities of the westerlies dissipating later this Summer, does this mean that we may have ENSO - neutral for next Fall and Winter or a fourth year of La Nina ?
At this time, here are the…
At this time, here are the current probabilities and chances for each outcome: https://www.cpc.ncep.noaa.gov/products/analysis_monitoring/enso_advisory/ensodisc.shtml
(see Figure 7 for chances of El Nino, Neutral, and La Nina). This will be updated on May 11th.
Seasonal ENSO deltas...
Michelle,
Is there any significance of the delta in ENSO magnitude from the recent winter to the incoming summer season? Example, if February 2023 was -0.4C and the forecast for July 2023 is 1.1C , is that 1.5C delta significant in any way? Most research appears to look at it from a static perspective, but maybe the change from one period to the next is equally if not more significant?
More significant, how? In…
More significant, how? In terms of making a forecast more likely? Models are initialized with current observations, so don't care about the past ones. With that said there are known "momentum" problems during the spring which do depend on the past rate of change. But then this implies that the forecasts are actually *too* confident.
2014 dud
Interesting 2014 is considered an El Nino dud. That's was the beginning of a weird weather pattern off the coast of California where we had lots of light southerly winds (not associated with low pressure systems) during spring instead of the normal North-Westerlies that give us all the upwelling. We haven't had that pattern this year, the North-Westerlies have been in full effect and we've had some of the coldest coastal water in ten years as a result. If correlation(that is, if similar patterns can be discerned from past data) can be relied on that might help sway an opinion one way or another during the spring predictably barrier.
El Niño is not okay
U know El Niño is not good at all for Wisconsin winters I hate warm winters I hope this forecast is wrong.
I want El Niño stop…
I want El Niño stop developing. It’s diesase. California needs wildfire next winter. U can’t always have wet winters Wisconsin winters are getting warmer because that evil El Niño. Southern states don’t need snow. I rather have them get hurricanes sorry.
Thank you very much for your…
Thank you very much for your explanation. Is there a way to forecast long-term wind anomalies in the El Nino 3.4 region?
Greetings!
Wind anomalies are difficult…
Wind anomalies are difficult to forecast over the long-term. In general, what makes them easier to forecast is the state of ENSO to begin with. If an El Nino or La Nina has already formed, long-term wind anomaly forecasts become more skillful as the ocean and atmosphere have coupled. Absent this coupling, however, like in ENSO-Neutral or the development phase of El Nino or La Nina, it can be a bit more difficult.
Comments have been disabled on this article