May 2025 ENSO update: eye of neutral
The tropical Pacific is in ENSO-neutral conditions, and neutral is expected to continue through the Northern Hemisphere summer. Neutral is also the most likely outcome for the fall and winter, although chances of La Niña are a close second. Today, as your trusty representative of the ENSO forecast team, I’ll cover current conditions in the tropical Pacific, what we mean by neutral, and what it means for seasonal climate prediction… with a side of Macbeth (footnote 1).
The ENSO cauldron
First, let’s set the stage for why we care so much about El Niño and La Niña, the natural climate pattern collectively known as ENSO, the El Niño/Southern Oscillation. El Niño and La Niña change global atmospheric circulation and the jet streams in known ways, with impacts on extreme rain, drought, snow, heatwaves, the range of daily temperature, tornado and hurricane seasons, global crop yields and disease outbreaks, and many others. El Niño and La Niña can be predicted many months in advance, so they provide an early picture of potential climate conditions and allow for preparation and planning.
If it were done when 'tis done
Our primary yardstick for ENSO is how the temperature of the ocean surface in the Niño-3.4 region of the central tropical Pacific compares to the long-term average. (Long-term is currently 1991–2020). Warmer than average by 0.5 °Celsius (0.9 °F) or more is El Niño, while cooler than average by 0.5 C or more is La Niña. Between them—within 0.5 °C of average—is ENSO-neutral territory.

April 2025 sea surface temperature compared to the 1985-1993 average (details on climatology from Coral Reef Watch). The box indicates the location of the Niño-3.4 ENSO-monitoring region in the tropical Pacific. The surface of the east-central tropical Pacific is near average, while much of the global ocean remains warmer than average. NOAA Climate.gov image from Data Snapshots.
According to our most reliable long-term sea surface temperature dataset (see footnote), the Niño-3.4 region was just 0.16 °C (0.3 °F) cooler than the long-term average in April. This is solidly in ENSO-neutral territory for the second month in a row.
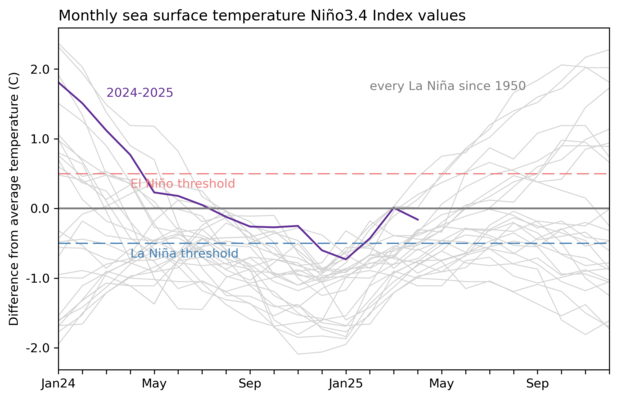
2-year history of sea surface temperatures in the Niño-3.4 region of the tropical Pacific for all La Nina events since 1950 (gray lines) and the recent (2024-25) event (purple line). The Niño-3.4 index has been near average for the past two months. Graph by Emily Becker based on monthly Niño-3.4 index data from CPC using ERSSTv5.
We ENSO forecasters also monitor the temperature of the water under the surface of the tropical Pacific because it can reinforce or change temperatures at the surface. Currently, the subsurface is also very close to the long-term average.
Turning to the atmospheric side of ENSO, some features are reminiscent of La Niña, but the brew this month has more ENSO-neutral flavors. We monitor many different aspects of the Walker circulation, the overturning atmospheric circulation in the tropical Pacific, to get a full picture of the strength of the circulation. During El Niño, the Walker circulation is weakened: weaker easterly (from the east) trade winds, a rainier central Pacific, and drier Indonesia. La Niña strengthens the circulation: stronger trade winds, a drier central Pacific, and a wetter Indonesia. When ENSO is neutral, winds, rainfall, and cloudiness are all near average.

Two ways of looking at the atmospheric conditions in the tropical Pacific: the Equatorial Southern Oscillation (left) and cloudiness in the central Pacific (right). The colored lines show 2024–25, while the gray lines are every La Niña on record since 1979. Both measurements provide evidence that the Walker circulation strength is near to average, after several months of being stronger than average. Climate.gov graph, based on data from Michelle L’Heureux.
Currently, we find that cloud cover over the central tropical Pacific is slightly reduced, easterly trade winds are modestly stronger than average near the Date Line, and the sea level pressure pattern across the Pacific (as measured by the Equatorial Southern Oscillation Index) is slightly positive. All these indicators are consistent with a stronger Walker circulation, so the tropical Pacific atmosphere is maintaining a slight La Niña-ish lean. However, these are the closest to average we’ve seen in some time, and these monthly measures of the tropical atmosphere bounce around a lot more than the ocean ones.
Nothing is but what is not
A question we often get here at the ENSO Blog is “what are the impacts of neutral?” That’s a great question! After all, I listed a whole bunch of effects from El Niño and La Niña in the second paragraph of this very post. However, neutral doesn't have a signature pattern of weather effects. When El Niño or La Niña are in charge, they change atmospheric circulation and push the jet streams around in specific ways, leading to their typical impacts, and making the seasonal climate more predictable. In their absence—that is, neutral conditions—other, less predictable weather and climate patterns can be more important.
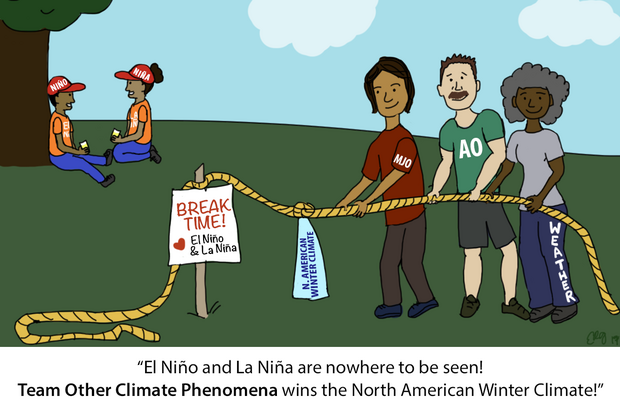
Concept by Tom Di Liberto and illustration by Emily Greenhalgh, NOAA Climate.gov.
Examples of other climate patterns include the North Atlantic Oscillation and the Madden-Julian Oscillation, both of which are known to influence temperature and rain/snow. However, they are largely only predictable a few weeks in advance, so they don’t give us the same kind of long-range prediction edge as El Niño or La Niña.
If you can look into the seeds of time and say which grain will grow and which will not
The current outlook for ENSO is very similar to last month’s, with a 74% chance of neutral through the summer. Neutral continues to be the most likely scenario through the winter, although La Niña is a close second. Odds of El Niño next winter are relatively small, at about 15%.

Out of the three climate possibilities—La Niña, El Niño, and neutral—forecasts say that ENSO-neutral conditions (gray bars) are most likely for the Northern Hemisphere spring and summer. Looking out to the fall, neutral is still the most likely, but chances for either La Niña (blue bars) or El Niño (red bars) are increasing. NOAA Climate Prediction Center image.
ENSO prediction in the spring is notoriously difficult, a time known as the “spring predictability barrier.” (Check here and here for more details on the spring predictability barrier.) In the coming months, we’ll emerge from this period, and as we draw closer to the winter, our forecasts should gradually become more confident.
A little peek behind the scenes: when Michelle was drafting this month’s ENSO Diagnostic Discussion, she messaged the team to say it was tough not just to repeat April’s discussion. This is another difficulty of ENSO-neutral conditions! It’s been a long time since we’ve had an extended stretch of neutral (you can check out our 75-year historical record of ENSO here). But that doesn’t mean we’re out of things to talk about here at the ENSO Blog, so watch this space!
Footnotes
1: All the section headings are quotes from Shakespeare’s Macbeth. Should I have used quotation marks? Maybe. But we all agreed that looked weird.
2: For official ENSO monitoring, we use the Extended Reconstructed Sea Surface Temperature data set, now on its 5th version. Details on what’s in the latest update are available from NOAA National Centers for Environmental Information.
Comments
So you do not look at last nmme forecast
the nmme nino3.4 forecast which updated yesterday has switched to la nina realm
The NMME is one of many…
The NMME is one of many inputs we use in our monthly ENSO outlook. This month, the NMME ensemble mean (the average of all the individual models) does dip into La Niña by the late fall, but we use probabilistic information from the NMME. That is, the range of potential outcomes shown by the 100+ ensemble members, which are currently pretty close to evenly split between neutral and La Niña... much like the official ENSO forecast! Thanks for your close eye.
Love These!
Keep up the good work
Thanks to you all
Thank you for sticking with the tracking and forecasting, under current circumstances your Shakespearean levity is welcome.
Professional and allusive! Who knew forecasters read Macbeth?
I for one am glad they do
Cheers to your team
Joe - NorCal
ENSO forecasting
Hello Michelle! As you mentioned, the ENSO forecasting world is somewhat dull as we speak, so I want to talk about something else. I am still immensely curious as to why La Nina was so late and short-lived (or didn't arrive at all depending on who you ask). I honestly think you guys were doing the best you could but it just fascinates me that in basically every diagnostic discussion since February 2024 (when the la nina watch was issued) that confidence in la nina was pretty high, but it never materialized into a full, months-long event. While I imagine that nobody knows the true answer, have there been any further theories or studies in the last few months that might have some truth to them?
Forcing of ENSO
<i>" ... any further theories or studies in the last few months that might have some truth to them?"</i>
Climate scientists have still not scratched the surface on applying signal processing to climate data, especially natural climate variation such as El Nino. Consider just Fourier analysis. I recently revisited a Fourier analysis of the ENSO NINO4 time series, that I first looked at around 10 years ago. I still see the same indications of tidal forcing in the Fourier spectra, with every primary lunar tidal showing up as the only symmetric sidebands of the annual carrier, which I had noted before (and subsequently published). The upshot of this is that the erratic cycling of ENSO is clearly a result of tidal forcing interacting with the annual cycle.
Whether this is the truth and whether other scientists can handle the truth is another matter.
Late ENSO
I believe scientists know why La Nina arrived later than forecast. On why La Nina did not come in as forecast, it is because as far as forecast modeling has come over the years it is still not perfect and sometimes events do not come out as forecast
you need look at the relative nino3.4 index
Because of global warming,
Traditional nino3.4 will always be warmer than what atmosphere looks like. I think this year will be similar to 2024. Atmosphere will more la-nina-ish than ocean
relative Nino-3.4
Yes, it's a good point, and the ENSO forecast team has been regularly monitoring the relative Nino-3.4 index, though the official NOAA ENSO classification is still based on the traditional Nino-3.4 index (ONI). If the relative index still remains quite a bit cooler than the traditional index through the next few seasons, then we may see La Nina-like impacts even if the traditional index remains in neutral territory (like what I discussed here and here, though for marginal La Nina rather than neutral conditions, but the same idea applies).
Thanks
Me gustaría decirles esto desde hace mucho tiempo, muchas gracias por sus esfuerzos en estos temas que son tan relevantes para nosotros en la agricultura mundial, espero que sean fuertes y gloriosos por la gracia de Dios y de la humanidad. Saludos
Muchas gracias, muy…
Muchas gracias, muy agradecido!
Parabéns
Detalhamento de fácil entendimento!
thank you
Thank you (obrigado)!
El nino and souther oscillation
ENSO means El nino and southern oscillation have a very close relation in last few decades. But these were in different phase in recent years and maybe this condition will continue in next few years.So do you think, cpc will split enso in to el nino/la nina and southern oscillation. It maybe better to forecast they independently. Because nowadays southern oscillation will tend to be positive while ocean is always warm
ENSO and SOI
It's true that ENSO, as monitored by the Nino-3.4 sea surface temperatures, and the Southern Oscillation Index do not track each other perfectly, but I am not sure what you mean by El Nino and the Southern Oscillation have been out of phase in recent years. Overall, when we average over three-month seasons, the Southern Oscillation Index (SOI) generally has tracked the Oceanic Nino Index (ONI) in the way we expect for El Nino and La Nina - compare the SOI table with the ONI table.
The effect of ocean warming on our traditional indices is an important consideration, and that is why some have advocated for a relative Nino-3.4 index over the traditional index that carries some of that global warming influence unrelated to ENSO. We expect the relative Nino-3.4 index to maintain a closer relationship with the SOI. So I can understand your point that we didn't see as strong a relationship between the SOI and traditional Nino-3.4 index in the most recent El Nino (2023/24), but we wouldn't expect to separate the SOI from ENSO because ENSO is a coupled phenomenon that requires interaction between the tropical atmosphere and ocean. The better solution may be use alternative indices like the relative Nino-3.4 index that better capture this interaction.
Your suggestion about forecasting El Nino/La Nina and the Southern Oscillation separately is interesting. As I mentioned above, we won't be able to separate the Southern Oscillation from ENSO (one of the requirements for El Nino/La Nina is that the tropical atmosphere is consistent with El Nino/La Nina conditions, and that will be reflected in the Southern Oscillation), but we still could consider what it would take to forecast the part of the Southern Oscillation that is independent of ENSO. Because the SOI is an atmospheric index, it bounces up and down a lot more than the Nino-3.4 region sea surface temperatures. So, if we subtracted out the part of the SOI that is tied to the ocean surface temperatures (again, probably using the relative Nino-3.4 index), then I suspect that what's left of the SOI is mostly predictable on weather and subseasonal timescales. So, it may be useful on those shorter timescales, but I suspect that the seasonal predictability of the ENSO-independent SOI would be quite small.
so if southern oscillation…
so if southern oscillation equals to SOI, ONI is the same thing as el nino. What do eqsoi,trade wind,olr and so many other indices stand for? Maybe it is better to contribute all there atmospheric response to southern oscillation.For those oceanic indices such as nino1 to 4,heat content --- they are all el nino-la nina
Indices
To be clear, El Nino and La Nina are not the same thing as ONI (Oceanic Nino Index) - the ONI is just the primary metric used for classifying El Nino and La Nina. In fact, the ONI criterion alone is not sufficient to declare El Nino or La Nina conditions (see the ENSO decision flow charts here and here). The tropical atmosphere also has to show clear El Nino or La Nina conditions as well (as demonstrated by the tropical atmospheric indicators you mentioned - SOI, EQSOI, trade winds, central Pacific OLR, etc.). It is generally the case that when the ONI reaches the El Nino or La Nina threshold and the ONI is expected to persist above the threshold for several seasons, then it means that those atmospheric indicators will, on average, also be consistent with El Nino or La Nina. So, the tropical ocean and atmosphere indicators of ENSO are all important. One of the points I tried to make is that those atmospheric indicators bounce up and down more than the oceanic indicators, so a single snapshot of the SOI, EQSOI, central Pacific OLR, etc. is a less reliable indicator or El Nino or La Nina than the ocean indicators like ONI (but - as mentioned above - ONI has its limitations too!).
La NIna SSTs CFSv2
Hi Nathanial,
I was looking the latest NMME runs the other day. Their SST plots show negative anomalies close to La Nina around December. Looking at the individual members that made up the plot, the CFSv2 shows similar negative anomalies happening around December. I look at the CFSv2 plots and maps at various sites and none of the CFSv2 plots I look at forecast negative anomalies during that period. Where does the difference in the NMME CFSv2 plot come from?
CFSv2 SST
Hi Bob, just to make sure I am on the same page, I assume you are referencing differences between, for example, this site, which shows CFSv2 November SST anomalies near zero, and the NMME site, which shows CFSv2 November SST anomalies that are clearly negative. That's a good question. Offhand, I do not know why there are such differences - I assume it mainly has to do with the way the climatology or bias correction is handled among the groups doing the data processing, but that's just a guess. I will look into it.
CFSv2
Thanks Nathaniel!
Yes that site and the CPC which shows no anomalies and the PDF corrected version. Only the NMME posted one shows cooler than average SSTs
https://www.cpc.ncep.noaa.gov/products/people/wwang/cfsv2fcst/imagesInd…
there are too many different ways to declare an ENSO event
Different countries have different ways,JMA uses NINO3, BOM uses NINO3.4 and SOI, CMA might be the most similar organization to NOAA, but they almost never think highly of atmospheric indictors. Oh I ignore Peruvians.SInce coastal enso is not the same thing to what we usually mention.EVen different apartments in the NOAA have different bias. PSL always uses MEI,but seldom does CPC
declaring an ENSO event
I agree that we do not have a single set of criteria to declare an ENSO event that is accepted globally. Some of the differences relate to differences in impacts to different regions - for example, coastal El Ninos are quite consequential to Peruvians but do not have much impact on the U.S. For the more canonical, basin-wide ENSO events, we need to keep in mind some of these differences in definition among agencies, but most of the time there is agreement in what is declared an ENSO event. Most importantly, we need the criteria to be applied consistently and objectively within each agency or organization.
about MEI
Hi Nathaniel
I have bothered you so many times,thanking for not asking me so patiently.
want to ask about MEI. I think MEI is a better criterion for recent years.BUt why does CPC not use it in official enso outlooks.Another agencies outside US do not ues it too. Only PSL uses MEI to reanalysis past ENSO events. You mentioned above that atmosphere bouces more often than ocean,but you still ues soi/eqsoi/olr/u wind, If use MEI,it will give a simpler indictor to describe atmosphere.
MEI
You're welcome, and no problem!
I cannot speak for CPC, so I am only offering my perspective here. I think the MEI may be quite useful for describing past ENSO events, but the Nino-3.4 sea surface temperature is still a very good metric for capturing the slowly evolving component of ENSO that is predictable on seasonal timescales. So, I suspect that a lot of the differences between the MEI and Nino-3.4 indicators of ENSO relate to the atmospheric part of the MEI that may be an important descriptor of what actually is occurring in the tropics but that is not particularly useful in seasonal prediction. If what I suspect is not completely correct, I would love to see some analysis that shows otherwise (and shows that there are important impacts of a seasonally predictable, ONI-unrelated component of the MEI).
So, I would not disregard the MEI - we should consider all metrics that provide a useful description of the climate state. However, I think there is value in a metric that simple, a reasonable measure of the phenomenon we are monitoring, and a clear target for our seasonal prediction models, and the Nino-3.4 sea surface temperature has done a pretty good job in all these regards.
DOUBT
What is the mechanism that triggers the ENSO phenomenon?
ENSO in a nutshell
Hello! I recommend reviewing some of our earlier blog posts (like here and here) as well as the climate.gov ENSO information page for the sort of background you are looking for.
Modoki stlye warming epac cooling
I have noticed that many enso models are indicting modoki like warming with warm nino 4 and cool nino 3 but it isn't a full fledged modoki nino or canonical nina. Do you think there is any merit to these forecasts of a warmer nino 4 and cooler nino 3.
warm CP/cool EP
I'm not sure. Typically, such sea surface temperature patterns (warm central Pacific/cool eastern Pacific or vice versa) have been associated with transitional phases of ENSO (and captured by the so-called Trans-Nino Index). Since we are at a time of year when ENSO prediction is so challenging and the uncertainty is high, I hesitate to speculate on what sort of ENSO or ENSO-like "flavor" we might see. We'll keep an eye on it!
Falling La nina odds rising el nino odds
Its been a little over two weeks since this blog was released and i must say i feel like el nino odds are rising and la nina odds are falling, Maybe its an overreaction to short term intraseasonal variability but im now seeing on many models (eps gefs geps) a collapse of the strong trade regime and wwbs at the start of june. Of course one wwb doesn't do much in the way of long term trends but models in May assumed a strong ewb in June so perhaps they were overdoing trades the rest of the year? Also the mjo going into phase 6-8 ( even if weak) Should still support wwbs and then into cod which means you arent gonna restart the trades thru the mjo since its avoiding the indian ocean. Of course this assumes models are correct in these forecasts and its the spb so of course they could bust but it was just something i noticed. And hey im new to enso forecasting so like i said this could just be a one off wwb and trades surge in july. I am also not sure how much to take into account these short to medium range models with enso.
It's a struggle... CFSv2 in…
It's a struggle... CFSv2 in particular (and I suspect a lot of other models) tend to be quite sensitive to the latest wind variability forecasts. See paper here:
https://www.cpc.ncep.noaa.gov/products/people/yxue/pub/35.pdf
This behavior is fine if the transition is meaningful, but it's not fine when it's a false alarm. So, I think the thing to keep in mind is that ENSO is a *seasonal* average pattern of variability and while the *sub-seasonal* may be important to its trajectory, it's important to see the forest from the trees and evaluate the tendencies of the overall coupled system. Luckily, even if a change in winds ends up being important (e.g. a westerly wind burst happens), we have time to evaluate its consequences and watch how the models respond. ENSO is just not at all like a weather forecast-- so we just don't need to immediately react to a fluctuation in the winds. We can remain patient and see how it works out & watch the other slower-moving parts of the system as well. Hope that helps!
Thanks
Thanks
How el nino devlops
For el nino to devlop do you need a reverse of the trades or just a weakening?
Just a weakening. A full…
Just a weakening. A full reversal of the trade winds is uncommon, usually (but not always) occurring in the peak of a strong El Niño.
Weather 2025
Thank you very much to you guys for such a great work. The way you explain and illustrate the themes are very easy to understand. I do really appreciate your dedication.
Keep going with your greater job of trying to better the certainty of the weather forecasts, which have become essential in our daily life.
Neutral
Good note.
CFSv2 and NMME
The NMME for July came out yesterday. Still looks like ENSO Neutral this year with cooler than average anomalies above the threshold for a La Nina. Still wondering about the CFSv2 though. The CFSv2 spaghetti plot used to produce the plot looks cooler than what I am seeing from other CFSv2 plots posted online
CFSv2
I apologize for not responding earlier, but I agree that the discrepancies between the CFSv2 plots are tough to explain. We have looked into the possible reasons but don't have a satisfactory answer at this point. We appreciate that you pointed this out.
CFSv2
Thanks Nathaniel
This month the same thing seems different
CFS on IRI is warmer than CPC now.
You might know the website named Tropical Tidbits. CFS on that website is even different
Comments have been disabled on this article