October 2015 El Niño update: Pumpkin spice
As we approach peak pumpkin spice latte season, we’re also closing in on the peak of the 2015-2016 El Niño, expected by forecasters to occur in the late fall or early winter.
This El Niño continues to rank among the strongest in our records, which start in 1950. The July-September 3-month average sea surface temperature (the ONI) was 1.5°C above normal, third in line behind July-September 1987 (1.6°C) and 1997 (1.7°C). The atmospheric response to the warmer-than-average sea surface temperatures is keeping pace, too: the Equatorial Southern Oscillation Index (EQSOI) is -2.2. This is second to 1997’s -2.6, and well ahead of the next two El Niños on the list (1972 and 1982, tied at -1.4).
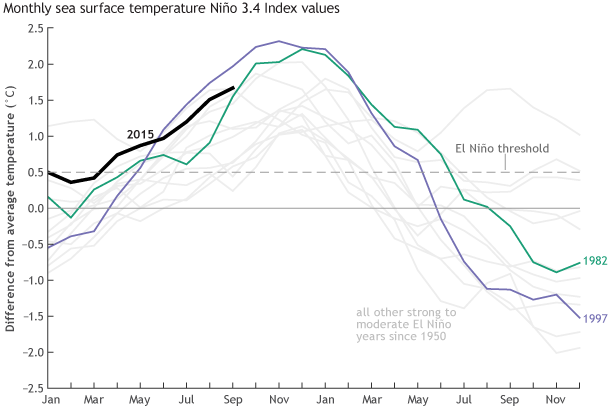
Monthly sea surface temperature in the Niño 3.4 region of the tropical Pacific compared to the long-term average for all moderate-to-strong El Niño years since 1950, showing show 2015 (black line) compares to other strong events. Climate.gov graph based on ERSSTv4 temperature data.
The near-surface winds along the equator in the Pacific, which are important for maintaining the sea surface temperature anomalies, have lagged a bit behind the stronger El Niños so far. These winds, which blow from east to west under normal conditions, weaken during El Niño, allowing the warmer water in the western Pacific to move into the central and eastern regions. In 1997-98, the strongest event on record, the winds in the central Pacific weakened so much they reversed, and blew from west to east during October and November. This September did have consistently weaker-than-average winds, though, and October has started off with a strong westerly wind burst. We’ll be watching this region closely in the upcoming months.
Of seasonal averages and suchlike things
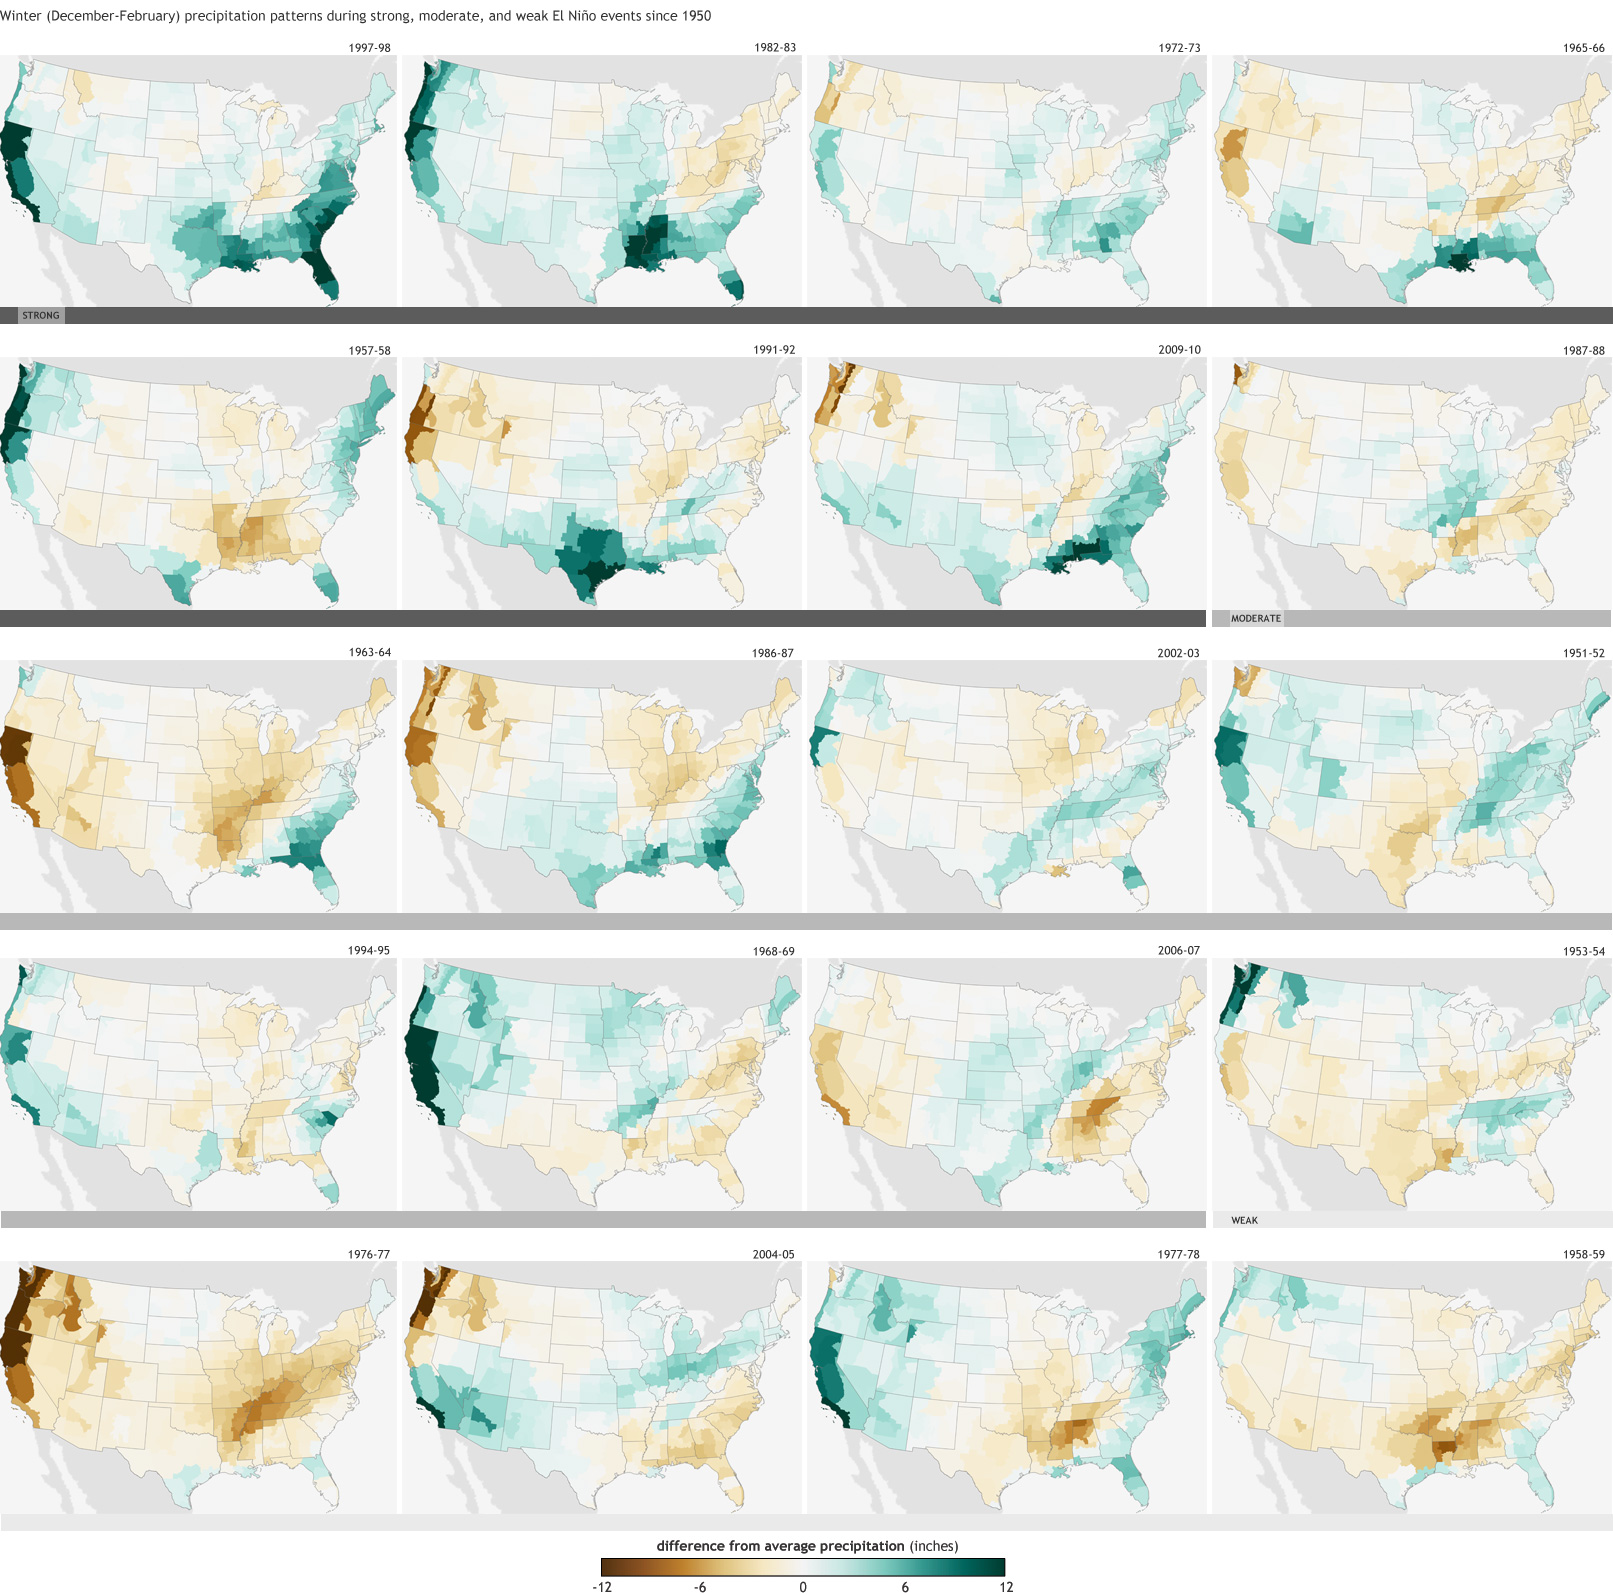
The Climate Prediction Center’s official seasonal forecasts for winter 2015-2016 give you an indication of what can be expected for the three-month average. For example, the forecast made in September shows a 70% probability that most of Florida can expect rain in the upper one-third of its historical record. The past history of El Niño events is a big factor in this forecast, and you may notice that the forecast looks similar to the map of December-February El Niño precipitation anomalies. Not exactly the same, because a lot of other factors go into the official forecast, but El Niño is the strongest signal.
This means that past El Niño winters can give us an idea of what we might expect for this winter. So I’m going to dig into some of these past winters to see how different from average they were in terms of daily weather. Some of the things we can consider are the number of rainy/snowy days in the season, or the number of days with heavy precipitation. (I’ll stick with “precipitation,” since the data I’m looking at are rain and water-equivalent snow.)
Since every El Niño event is different, this definitely isn’t a forecast—anyway, it’s impossible to forecast the exact number of rainy days. But it’s interesting to know what a season with “above -average” precipitation might mean to those of us who will experience the weather day to day.
In a post on our sister blog, Beyond the Data, Deke Arndt discussed how you might go into an El Niño expecting one thing (lots of rain!) but get another (uh, it’s kinda dry…) He illustrated how the average of six strong El Niños can cover up a lot of year-to-year variability, which is a very important point that applies here, too. You can expect one outcome, but know you may get another. We have maps showing the average precipitation during every El Niño winter on record; you can look at these and immediately tell that there is a LOT of variation.
Enough cautioning! To make the map below, I averaged the number of rainy days (here defined as a day with more than 0.1 inch of precipitation) during winter for six strong El Niño events: 1957-58, 1965-66, 1972-73, 1982-83, 1991-92, and 1997-98. This I compared to the number of rainy days during the 41 non-El Niño winters (either neutral or La Niña conditions). With apologies to Hawaii, Alaska, Canada, Mexico, and the rest of the world—the best data I had on hand only covers the continental United States.
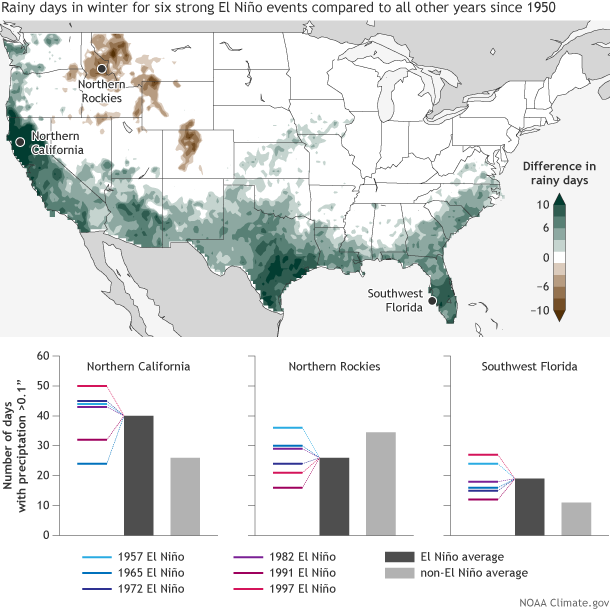
(top) Number of days with rain or snow (one-day total greater than 0.1 inch) in winter (December-February) during six strong El Niños (1957-58, 1965-66, 1972-73, 1982-83, 1991-92, and 1997-98) compared to the average during non-El Niño winters since 1950. (bottom) Details for three locations, showing total number of days with rain or snow during six individual strong El Niño winters (colored lines), the average number during strong El Niños (dark gray bar), and the average during non-El Niño winters (light gray bar). Image by FIona Martin, based on precipitation data from CPC Unified Rain Gauge Data.
In coastal northern California, a strong El Niño year averages about 40 rainy days per winter (December 1st through February 28th), compared to about 26 during a non-El Niño winter. Of the six strong El Niño years in our record, only one winter (1965) had fewer rainy days than the non-El Niño average. In southwest Florida, all six strong El Niño winters had more rainy days than the average of years without El Niño, although 1991-92 was only slightly above.
Heavy precipitation (defined here as days with more than 1” of rain or water-equivalent snow) can show more dramatic changes. For example, in south Louisiana, the overall number of days with rain increases from about 21 for a non-El Niño year to 29 for a strong El Niño year, but the number of days with heavy rain more than doubles, from 4 to about 8.5. Two of the El Niño years had about the average number of days with heavy rain, while four had nine or more.
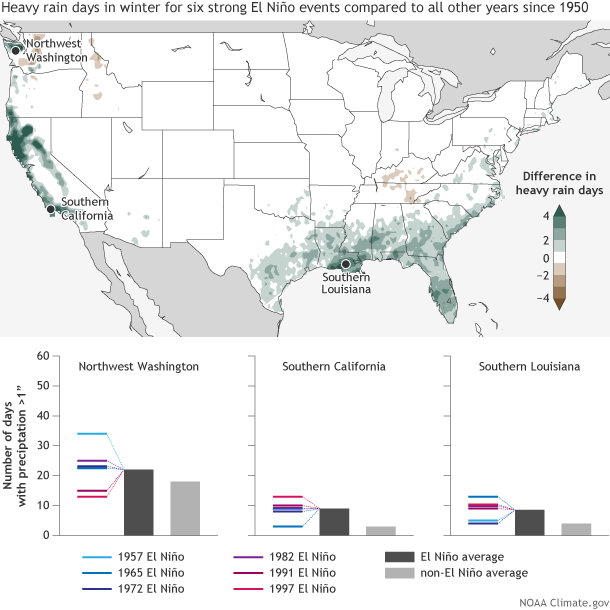
(top) Number of days with heavy rain or snow (one-day total greater than 1 inch) in winter during the six strong El Niños (1957-58, 1965-66, 1972-73, 1982-83, 1991-92, and 1997-98) compared to the average during non-El Niño winters since 1950. (bottom) Details for three locations, showing total number of days with heavy rain or snow during six individual strong El Niño winters (colored lines), the average number during strong El Niños (dark gray bar), and the average during non-El Niño winters (light gray bar). Image by FIona Martin, based on precipitation data from CPC Unified Rain Gauge Data.
Fist of Flurry
Here’s a fun fact for your next nerdy cocktail party… Boulder, Colorado has registered seven October snowstorms with more than one foot of snow since 1950, every one happening during an El Niño winter. Snowstorms are really complex weather events that are difficult to forecast, even just a few days in advance, so this isn’t to say that Boulder should expect a big snowstorm this month. However, thanks to El Niño, the odds are tilted toward greater-than-average rain or snow in Colorado, and much of the southern half of the country, in late fall and early winter.
We’re moving into the seasons when we’ll see the greatest impacts from this strong El Niño event, so stay tuned to your local weather forecast office. It’s always a good idea to pay attention to the weather forecast, but especially so with this strong El Niño in place.
Comments
El Nino 2005
RE: El Nino 2005
The 2004-05 El Nino was in the weak category, with peak 3-month ocean temperatures only 0.7C above average. But El Ninos differ from one another, and also there is not a very strict correspondence between El Nino strength and the strength of the climate impacts. This is an excellent illustration of the fact that the correspondence is somewhat loose. Also, while you fared well in the 1997-98 event, many others along the California coastline were not so lucky.
Lived in LA - the strong El Niño of the late 70's/early 80's
Excellent Explanation Emily!
RE: Excellent Explanation Emily!
I'm glad you appreciate Emily's intelligent, yet personable style of communicating. I agree 100%. About the El Nino climate effects adhering to state boundaries, it is not your imagination, but is indeed an artifact of the analysis method. That method uses discrete blocks of area called "climate divisions", of which there are 344 (I believe!) across the continental U.S. These divisions often have borders that match the state boundaries, and also attempt to conform to natural climate-determining boundaries such as mountain ranges or more subtle terrain features. So, the analysis is not totally continuous, but discrete. Of course, individual weather stations are used to determine the values of the climate divisions; in the western part of the country there are fewer stations, so the climate divisions tend to be larger.
I have been following the Sea
Rockies
RE: Rockies
The map is for the winter period of December to February. During that period, part of Colorado has a slight tendency to get below average precipitation during El Nino years. But in October, Colorado's response to El Nino is different -- it tends to get more big snow events. This shows that the climate impacts from El Nino vary by season as well as by location.
RE: Texas
Oceanic Nino Index
RE: Oceanic Nino Index
You are paying close attention to these SST datasets! This is a very impressive accounting of them. However, one thing I’ve noticed is that there is some redundancy in these datasets, so the values you are presenting aren’t independent of each other.
My understanding is that CDAS-1 (another name for it is "NCEP R-1") assimilates an old version of Reynolds OISST. The same is true of Kaplan Extended, which is reliant on real time updates of OISST. So from that list above, the only datasets with *recent values* that are truly unique in how they are constructed are: OISST, ERSST, and the Hadley SST.
Hopefully we will have a blog post in the future on this subject, but we strongly recommend using continuous “historical reconstructions” (i.e. ERSST, HadSST) to place the current El Nino in historical context. The primary reason for this is b/c the dataset creators spend a lot of time and effort to ensuring that the different observing systems, which are changing through history, are placed on equal footing. In other words, there is effort made to make sure the SST values today are adjusted so they can be compared to SST values of the past.
OISST is only used at NCEP because it is updated on a sub-monthly basis which the historical reconstructions do not provide. We require datasets like OISST to initialize our models or provide some information on a sub-monthly basis. But OISST has data ingests that are not corrected for, which means biases change over time. For example, a satellite in 1997 is different from today’s satellite (and keep in mind there are also corrections needed to get from the top-of-the-atmosphere to the surface).
As a result, we will be using the latest ERSST (v4) dataset to put this El Nino in historical context. However, I am very supportive of comparing v4 to other independent SST datasets like HadSST (provided they make the same effort at homogeneity). As you probably already realize SST values are only estimates because the tropical Pacific Ocean, and Nino-3.4 region, is imperfectly observed.
Thanks for sharing your analysis and bringing up this very important topic!
Pumpkin season
RE: Pumpkin season
RE: Pumpkin season
No snow in massachusetts?
RE: No snow in massachusetts?
No snow in Boston would certainly be an unusual occurrence, so don't think I'd expect to see that. However, if do see a warmer than normal winter, that could result in less snow than normal, and certainly less snow than last winter.
Don't you mean the "Eastern Pacific?"
RE: Don't you mean the "Eastern Pacific?"
The warmest waters are normally located in the western part of the basin. When the easterly winds weaken, that allows the warmer water in the western part of the Pacific to move east. Think of the easterly trades blowing the water toward the western Pacific. A weakening of these trades allows the waters to move back toward the east.
Pumpkin Spice Latte
RE: Pumpkin Spice Latte
While it's certainlhy possible that this event will begin to weaken prior to the end of the winter, at this time, expectations are that the event will persist through the winter, gradually weakening during the spring.
RE: Pumpkin Spice Latte
This comment made me laugh! Clearly, you're someone who gets Emily's humor.
Double peaked El Nino.
El Nino Winters 2015-2016
predicted vs actual
El Niño in the Galapagos Islands
California Rain
Pumpkin Spice Latte???
El Niño in Ecuador NOthern Peru
El Nino/ La Nina
Comments have been disabled on this article