El Niño from the other side of the Pacific pond
This is a guest post by Dr Andrew Watkins, Leader of the Climate Prediction Services team at the Bureau of Meteorology (BoM) in Australia. As well as releasing Australia's seasonal outlooks every month, the team write the BoM ENSO updates and communicate ENSO impacts for Australia. You can follow the Bureau of Meteorology on Twitter @BoM_AU.
Australia and the US share many things. They are roughly the same size, they both sit on the Pacific Rim, and their people love sports, music, and movies, plus the odd donut. But to a climatologist, there are a number of fundamental differences.
For a start, America is in the land-heavy Northern Hemisphere, while Australia is in the water-dominated south. This means that our seasons are directly opposite. For Australia, mid-summer really does occur in the middle of December–January–February, while mid-winter is the middle of June–July–August. This reversal of seasons suits us just fine—long balmy summer holidays to finish the year off for instance, though Santa's sleigh does get a little beaten up in the dust.
Australia v USA El Niño impacts
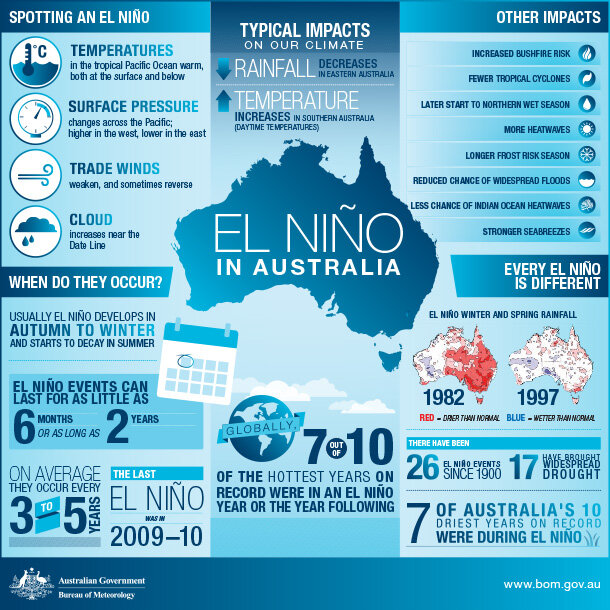
El Niño and its Australian impacts. Available at www.bom.gov.au/climate/enso
The other fundamental difference for a climatologist is El Niño. Or rather, El Niño impacts. While California and parts of the southern United States look to El Niño for welcome rains—particularly in 2015 when large areas are in severe drought—in Australia, it often brings the exact opposite: a dry winter and spring in the east, coupled with unusually warm to hot weather. Frosty nights are more common from cloudless night skies, our snow season contracts (yes, we do get snow on the peaks, and even to sea level in Tasmania once every few years), we often get more summer heatwaves and bushfires (wildfires), a later monsoon in the north and fewer tropical cyclones. Apart from reduced hurricanes and the tendency toward dryness in certain fairly small regions (the northern Rockies and the Ohio Valley), you can generally take US El Niño impacts and flip them over to understand what happens in Australia.
So while some in the US may understandably cheer for a drought-busting El Niño, down under we view these events with a little more trepidation.
Drought and rain
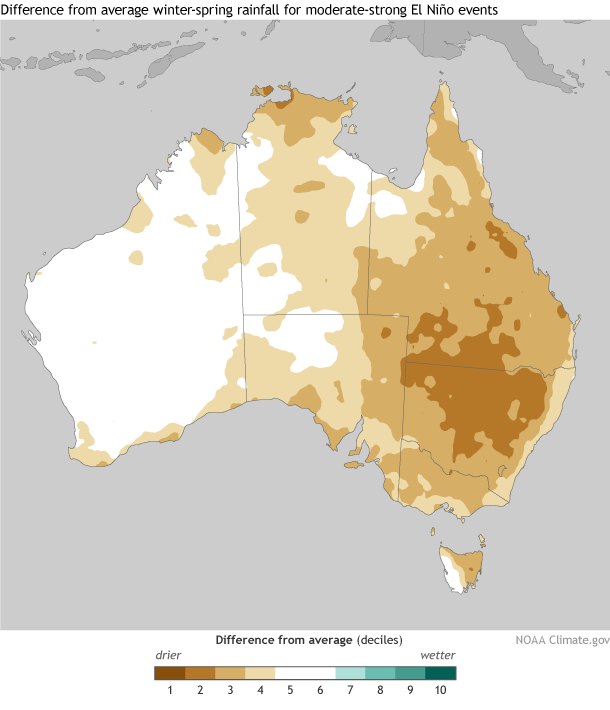
Average rainfall deciles for 12 moderate to strong El Niño events. [Deciles rank a time series into 10% bins. So Decile 1 is the 10% of years with lowest rainfall, while decile 10 is the 10% of years with highest rainfall.]
Winter (June-August) and spring (September-November) are the main crop and pasture-growing seasons for the Australian food bowls (the Murray–Darling Basin in eastern Australia and the southwest of Western Australia). They are also the time when El Niño hits these areas the hardest, with dry and warm conditions in many key agricultural areas. El Niño doesn’t automatically equal drought, but it certainly increases the risk. Of the 26 El Niño events since 1900, 17 have resulted in widespread drought for Australia.
The strength of El Niño doesn’t always match the strength of the impacts. True, in the big El Niño of 1982, Australia was hit hard, with one of the worst winter droughts on record for eastern Australia causing around $A3 billion ($USD2.75 billion) loss in agricultural production alone. And that’s in 1982 dollars too.
But in 1997-98—often dubbed the El Niño of the century—for most people, the impacts were far more benign than in 1982, despite winter being the eighth driest on record for Australia. Good rains came in the critical agricultural months of May and September, meaning that while some places were indeed dry overall, impacts were lessened—certainly nowhere near the devastating effects seen in some of our near neighbours. For instance, Papua New Guinea had crippling, and in some areas, life-threatening drought.
In almost direct contrast, winter (December-February) rainfall in the US was the seventh wettest—and temperatures second warmest on record in 1997–98.
Defining El Niño
The Bureau of Meteorology uses a different set of criteria than NOAA to define El Niño (and La Niña), primarily because each nation observes impacts at different stages of ENSO development. Likewise, last month guest blogger Ken Takahashi noted how Peru focuses on different parts of the tropical Pacific Ocean to define ENSO because of the unique impacts it has upon them.
At the Bureau we use a 'Tracker' to display where we see ENSO heading. The tracker is 'multivariate', meaning it depends upon several indicators, and is essentially scanning for the point in time when the ocean and atmosphere in the tropical Pacific are 'coupled'. When this occurs we're pretty confident that the ocean is warm enough to be causing changes in the atmosphere, which in turn are big enough to reinforce changes back on the ocean. Hence we have a positive loop that will ensure El Niño is going to hang around in the Pacific for at least several months.
The Bureau's El Niño–Southern Oscillation (ENSO) Tracker dial. Firmly at El Niño level since early May 2015.
The Bureau tracker hit El Niño status in early May 2015—two months after the NOAA declaration. But while this may seem a big difference, the Tracker was already at ALERT level, indicating around a 70% chance of a prolonged event forming during 2015. Likewise the NOAA declaration noted that there was a 60% chance of the event persisting into mid-year. This is basically the same information stated in a slightly different way; it's certainly not unusual for national agencies to differ slightly in when and how they determine an ENSO onset, even if they observe similar developments in the Pacific.
Using either tool gave an important heads up to those who need an El Niño warning. It's not like nature flicks a switch and El Niño impacts instantly arrive. Rather, there is a build-up period, during which some impacts may appear and some users need to prepare. Information provided by NOAA and the Bureau can give a very useful heads-up, often many months ahead.
Looking forward to the rest of 2015
Both the Bureau's and NOAA's climate model, as well as six other leading climate models from around the world that we survey every month, do indeed suggest this event will rival the big El Niños of 1972, 1982 and 1997. And as we've already noted in our fortnightly ENSO Wrap Up, this event is the strongest since 1997–98, with the Bureau's weekly sea surface temperatures easily passing the +2°C warmer-than-normal threshold in the key central Pacific 'NINO3.4' region, many months before El Nino typically peaks at the end of the calendar year.
But does this mean drought for Australia (or flood for the US)?
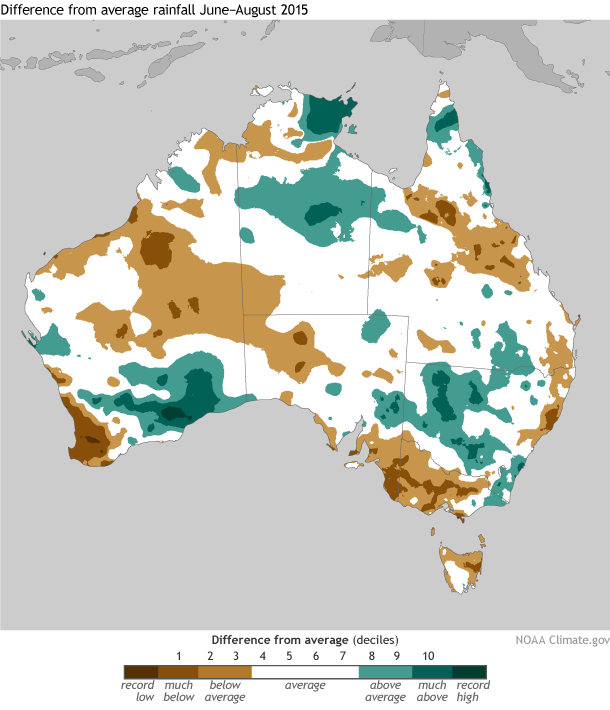
Rainfall deciles for winter 2015. [Deciles rank a time series into 10% bins. So Decile 1 is the 10% of years with lowest rainfall, while decile 10 is the 10% of years with highest rainfall.]
Well, so far 2015 has been a very mixed bag for Australia. Winter (i.e. June–July–August) was indeed warmer (8th warmest on record) and drier (16% below normal) than average for Australia; so at the big picture level it's following the El Niño script pretty well.
But in several areas traditionally hardest hit by El Niño, such as inland eastern Australia, winter rainfall has been average or even better. For instance, the Murray Darling Basin (MDB), which normally dries out during El Niño winters, had 114mm of rainfall—ranking 46th wettest since 1900. In contrast, the big El Niño winter of 1982 brought only 27mm to the MDB—driest in the 116 years of record.
That’s a bit confusing. Almost as confusing as the model outlooks from around the world, including our own, about half of which show increased likelihood of a wetter than average spring (September–October–November), when all the talk focusing only on a strong El Niño would make many think it's going to be dry.
Impact of Indian Ocean on Australia
So where might this wetter spring come from?
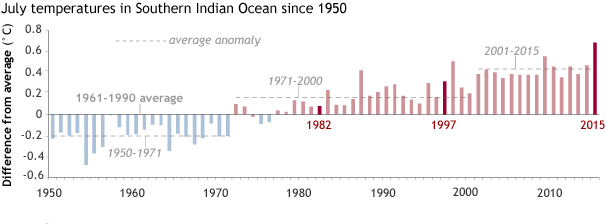
July sea surface temperature anomalies (difference from normal) for the Indian Ocean between 0 and 60°S.
A fair amount of our moisture, and key driver of our jet stream and hence weather patterns from the west, is the Indian Ocean. For many years we have known that the Indian Ocean Dipole (similar to ENSO, but in the tropical Indian Ocean) has a strong impact upon Australian climate. But the sub-tropical Indian Ocean, as well as sea surface temperatures closer to our coasts, also play a crucial role.
This year the whole Indian Ocean has been warm. Really warm. In fact June, July, and August were all warmest on record for the southern hemisphere Indian Ocean. The end result has been an El Niño with more mid-level moisture streaming in from the west than any of the old timers at the Bureau can dare to remember.
Secondly, with warmer-than-average waters in the Indian Ocean, but more typical or even cooler temperatures around Antarctica, there's been a change in the north-to-south temperature gradients. This change may have been forcing weather systems farther south. In contrast, closer to Australia the gradients are near normal, meaning these weather systems moved north again, colliding with the southeast of the continent. It's all due to a process known as the thermal wind, which governs where and how much winds increase with height, and hence the position of the jet stream and the storm track associated with it.
Nothing is ever simple when it comes to climate.
Managing risks & watching
El Niño is certainly a key player for both countries, but it isn’t the only driver of our climates. This means managing for the risks El Niño brings, but also watching for what else may be happening around us.
It only goes to highlight that despite having a few key differences (for a start, American high and low pressures spin the other way around), we're very much alike in so many ways. And that’s why NOAA and the Bureau will continue to work closely to better understand our shared Pacific and global climate.
To learn more about El Niño's impact on Australia's climate watch the Climate and Water Outlook September–November 2015. https://youtu.be/EaxtEYGusnQ
Tom Di Liberto, lead reviewer
Comments
El Nino Impact on Australia
Comments have been disabled on this article