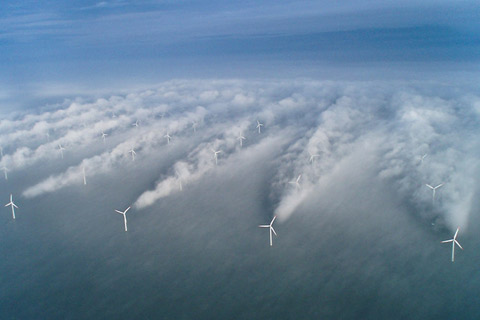
Normally invisible, wind turbine wakes come to life over the ocean, fascinating scientists who study winds in the lower atmosphere.
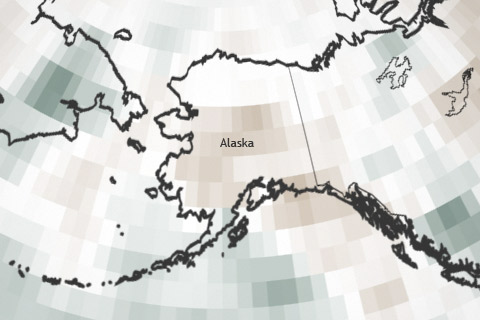
All but a handful of weather stations across Alaska reported well below-normal precipitation in May 2011, placing that month in a statistical tie with May 1974 as the driest May since records began in 1918.
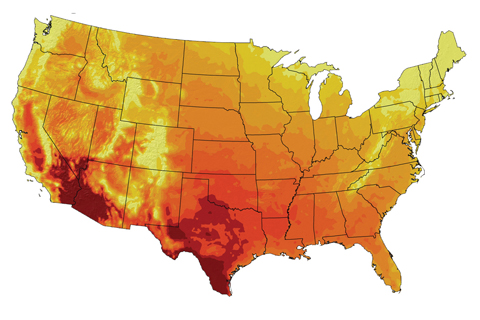
Climate models project that 100-degree days will become more numerous and widespread by the end of the century if greenhouse gas emissions continue to rise.
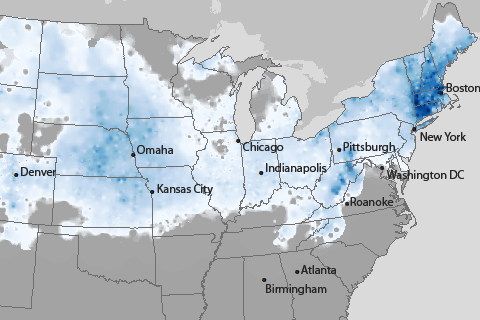
How did this year’s storms compare to the worst in recent history?
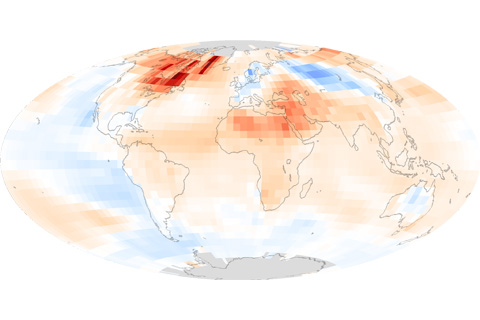
Capping off the warmest decade on record, the average global temperature in 2010 tied 2005 as the warmest year since reliable records began in 1880.

On Hawaii’s Big Island, prevailing Pacific trade winds from the northeast bring more rainfall to northern & eastern slopes, leading to dramatic differences in vegetation on different sides of the island.
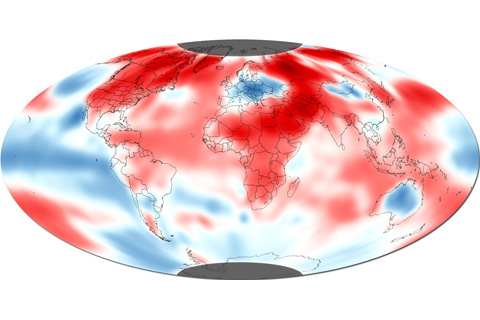
The average global surface temperature in October 2010 was 58.07°F (14.54°C), which is 0.97°F (0.54°C) above the historical average, according to the monthly assessment from NOAA's National Climatic Data Center.
Rising concentrations of carbon dioxide in the air lead to more acidic seawater. More acidic water corrodes minerals that many marine creatures rely on to build their protective shells and skeletons.
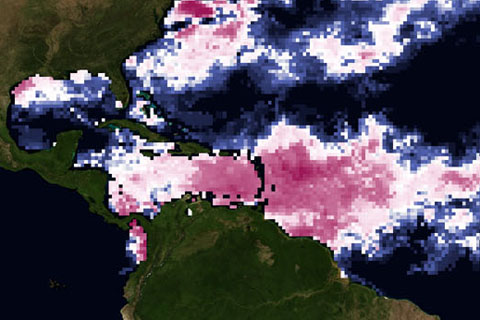
How do warm waters in the Caribbean this year compare to conditions in 2005, when high ocean temperatures triggered the worst mass coral bleaching event ever seen in the region?

When the winds are right, dust from the deserts of the U.S. Southwest blows onto the snow-capped Rocky Mountains. How do dirty snowfields contribute to the loss of more than 250 billion gallons of water in the Colorado River?