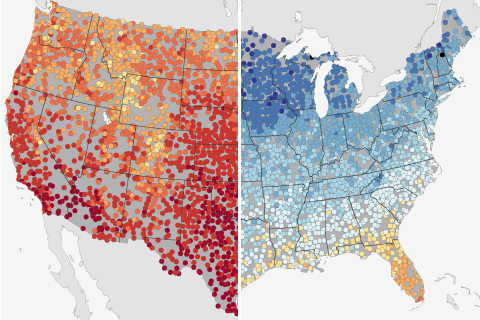
Based on historical climate data from thousands of stations across the United States, these maps show the warmest and coldest daytime high temperatures ever recorded at a given location on March 19—the astronomical first day of spring.
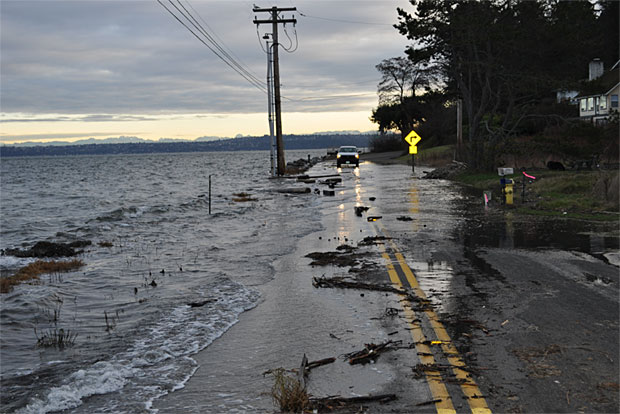
A Q & A about the science of detecting the influence of global warming on hurricanes, fires, and other extreme events.
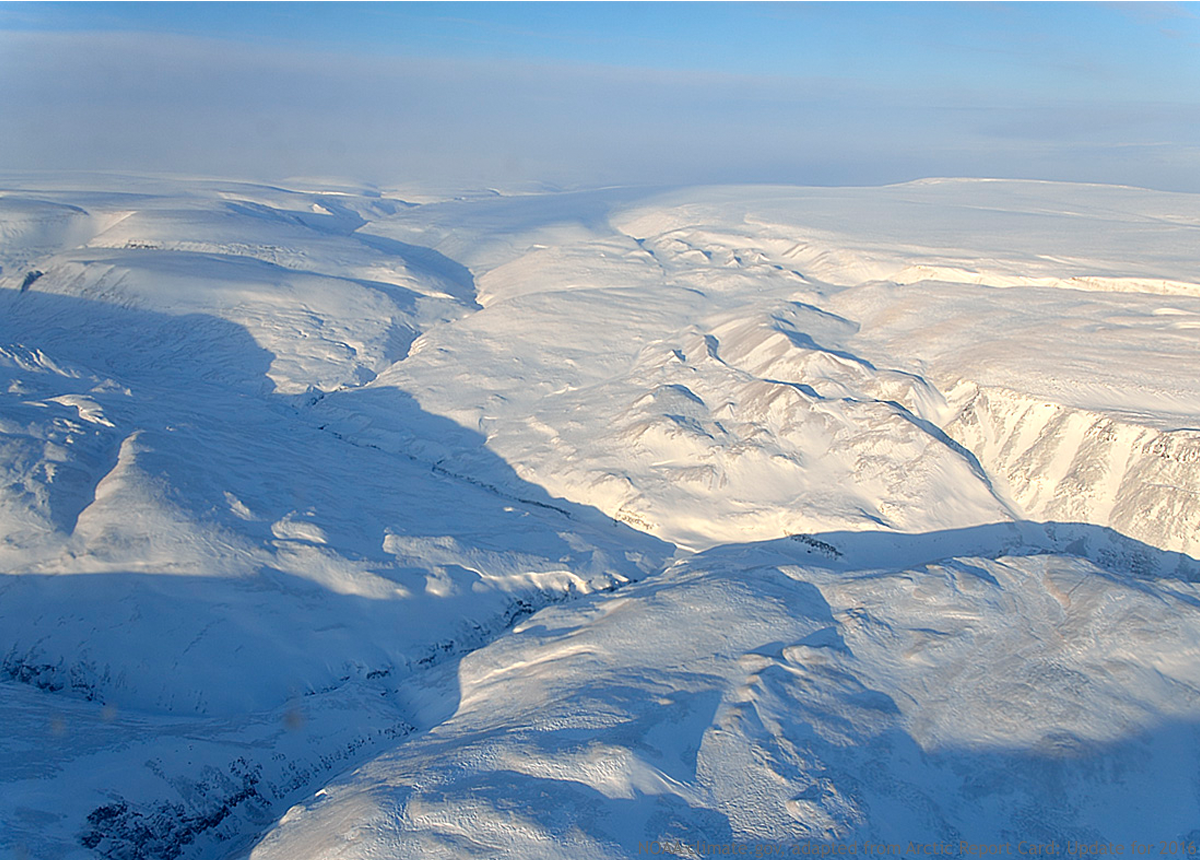
A new NOAA-sponsored report shows that unprecedented warming air temperature in 2016 triggered massive declines in sea ice and snow cover across the Arctic, and brought a record-breaking delay to fall sea ice freeze up. Learn more through our image highlights of the 2016 Arctic Report Card.
The ozone hole didn't cause global warming, but climate and the ozone hole are related in other ways.
In the 2015 edition of the State of the Climate report, climate and biology experts wrote about some dramatic impacts of warming on life in the ocean.
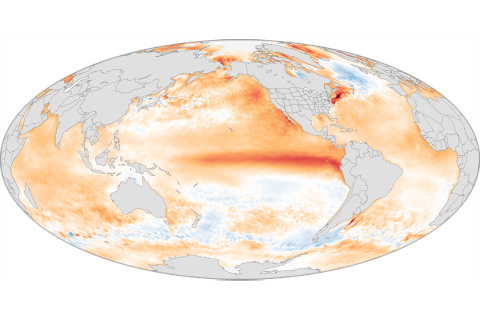
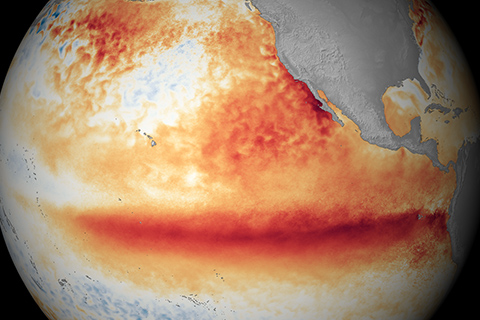
A record-smashing hurricane season in the central North Pacific. Water rationing in Puerto Rico. The biggest one-year jump in atmospheric carbon dioxide concentrations. These and more of 2015's extreme events had one thing in common: El Niño.
Free to good home! NOAA Climate.gov provides hundreds of images and maps that are free for re-use. This page gathers up links to our most popular El Niño and La Niña images.
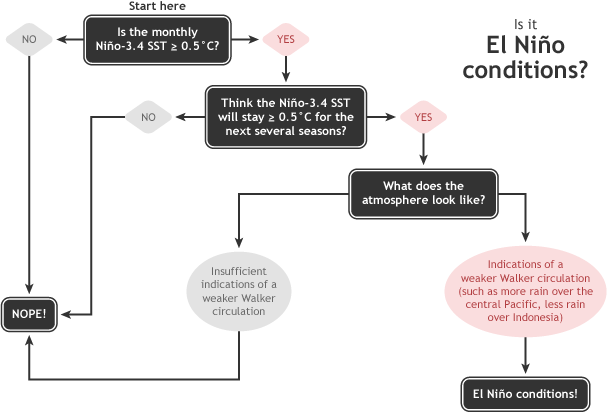
Answers to some of the questions that readers frequently ask NOAA experts about El Niño and La Niña.
NOAA's Climate Prediction Center monitors and issues outlooks for El Niño and La Niña using a 2-category (watch/advisory) alert system.
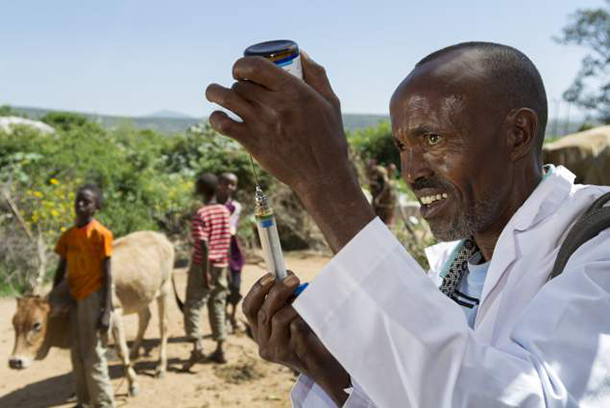
With this year's ongoing El Niño event, parts of East Africa may be ripe for a potential outbreak of Rift Valley Fever. See how government agencies are using climate data to help predict, and hopefully prevent, an outbreak of this deadly mosquito-borne virus that affects both people and valuable livestock.