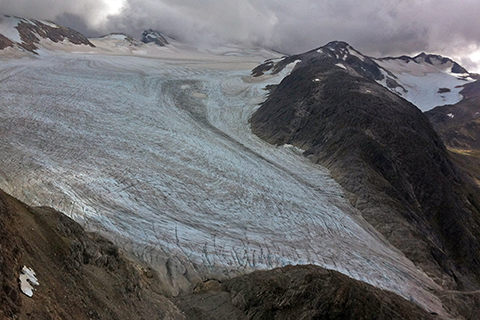
Worldwide in 2014, three dozen reference glaciers experienced an average mass loss equivalent to of 853 millimeters of water equivalent in 2014.
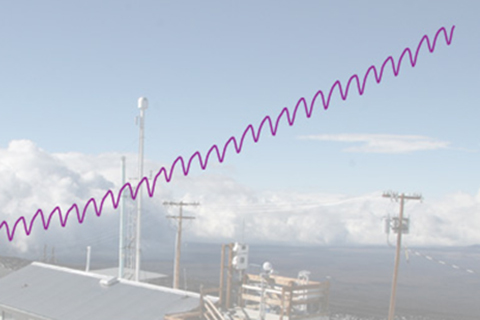
Scientists estimated global average carbon dioxide concentration at 397.2 parts per million (ppm) in 2014, as the global growth rate of carbon dioxide continues to accelerate.
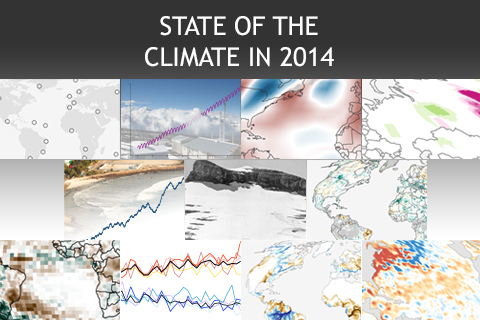
In 2014, the most essential indicators of Earth's changing climate continued to reflect trends of a warming planet, with several setting new records. Here are NOAA Climate.gov's highlights from the State of the Climate in 2014 report released online today by the American Meteorological Society (AMS).
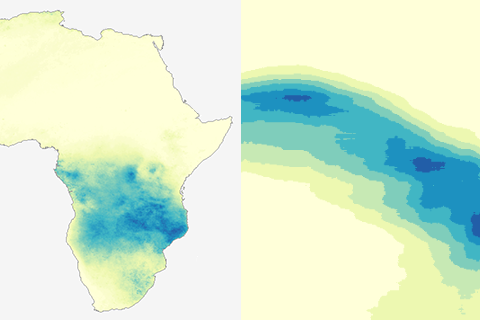
A post for map geeks. How to turn an animation of a year's worth of daily rain maps into a single picture.
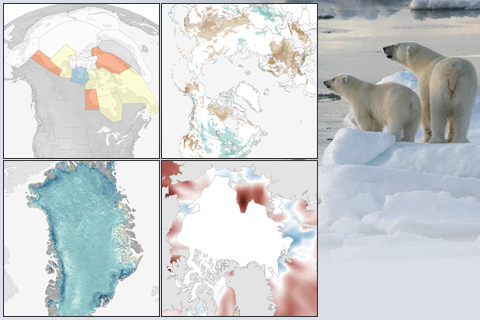
The latest installment of NOAA's Arctic Report Card confirms that Arctic air temperatures are rising at more than twice the rate of the planet as a whole. This collection of images highlights some of the key changes in physical and biological conditions in the Far North.
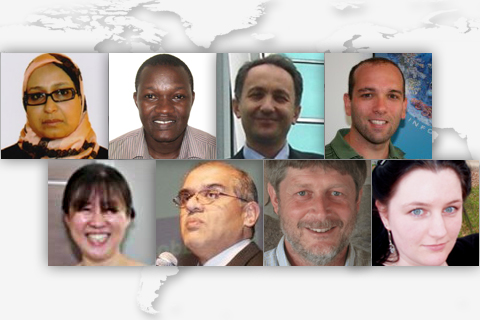
As the assessment now known as the BAMS State of the Climate report pushes into its third decade, international participation is at an all-time high. From atmospheric chemists to tropical meteorologists, more than 420 authors from institutions in 57 countries contributed to this year's report.
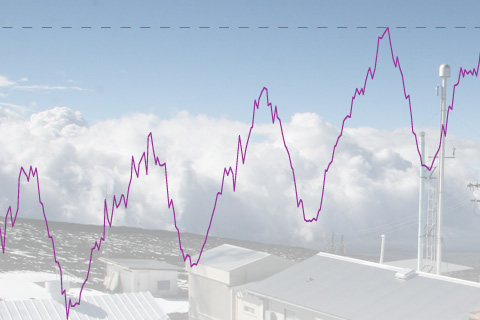
The annual average concentration of carbon dioxide (CO2) in the atmosphere stood at 395.3 parts per million (ppm) in 2013—a 27 percent increase compared to conditions before the Industrial Revolution. On May 9, 2013, the daily average concentration of CO2 surpassed 400 ppm for the first time at the Mauna Loa Observatory in Hawaii.
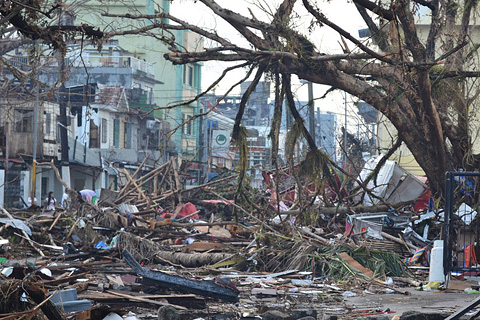
Super Typhoon Haiyan slammed into the east coast of Samar and Leyte Islands in the Philippines with what may have been the highest recorded wind speed for a tropical cyclone at landfall. Haiyan, locally known as “Yolanda,” was the deadliest typhoon in the country's modern record.
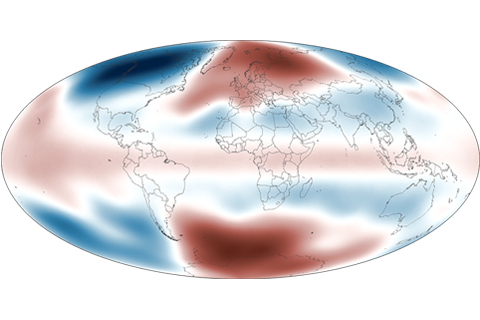
Observing temperature patterns in the lower stratosphere gives scientists clues about our planet's changing climate. Global average temperatures in the lower stratosphere for 2013 were slightly below the 1981–2010 average.
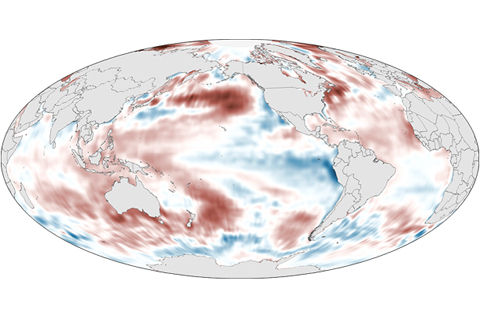
The globally averaged sea surface temperature in 2013 was among the 10 highest on record, with the North Pacific reaching an historic high temperature. ENSO-neutral conditions and a negative Pacific Decadal Oscillation pattern had the largest impacts on global sea surface temperature in 2013.