Extreme event attribution: the climate versus weather blame game
For more than a decade, scientists have been accumulating evidence that in some places, global warming is making several kinds of extreme weather events more likely or more intense. Heat waves? Check. Heavy downpours? Check. Deeper and more frequent high-tide flooding? Check.
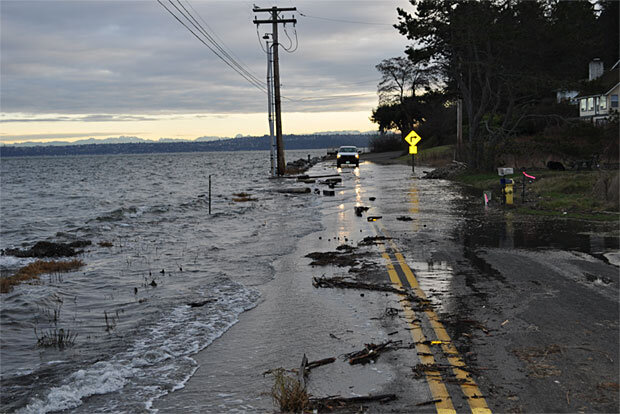
Nuisance high-tide flooding from Puget Sound in Port Orchard, Washington, on January 6, 2010. According to a NOAA analysis, tidal flooding events in nearby Seattle have increased from roughly once every 1-3 years around 1950 to once every 6-12 months today. Photo by Ray Garrido, courtesy of Washington Department of Ecology.
These long-term trends apply to averages across groups of similar events, usually spread over large areas—a national increase in heavy rain events, for example—not necessarily to a specific event in a particular place. How much global warming may have affected an individual extreme event—Sandy, the California drought, thousand-year floods in West Virginia or Louisiana—is a separate and much harder question. Answering it is the goal of a field of climate science called extreme event attribution.
Each year since 2011, NOAA scientists have served as lead editors for a special issue of the Bulletin of the American Meteorological Society called "Explaining Extreme Events from a Climate Perspective." The issue is devoted to studies that attempt to determine the causes of a selection of the previous year's extreme events and to detect whether global warming and its side effects were among them. This year's report is being released today at a press event at the winter meeting of the American Geophysical Union. In collaboration with the report's editors, Climate.gov has put together this Q&A that digs into the details of this rapidly maturing branch of climate science.
What is extreme event attribution?
Attribution is the process of giving credit for something, like crediting all the people who were involved in making a movie. Like a movie, any extreme event has lots of contributors; extreme event attribution is the science of deciding whether manmade global warming was one of them. Extreme event attribution tells us how much of the credit or risk for an event (or type of events) should go to global warming and how much should go to natural weather patterns or random climate variability.
Why do extreme event attribution studies?
Knowing whether global warming influenced the probability or intensity of an extreme weather event can help people in affected communities develop recovery and resilience plans that match their future risk. Research has already connected global warming to changes in the frequency of certain extreme events, including heat waves and extremely heavy rain, on a global scale. The goal of extreme event attribution is to provide a local-scale perspective that people, communities, and businesses can use to better anticipate future changes in extremes at their specific location.
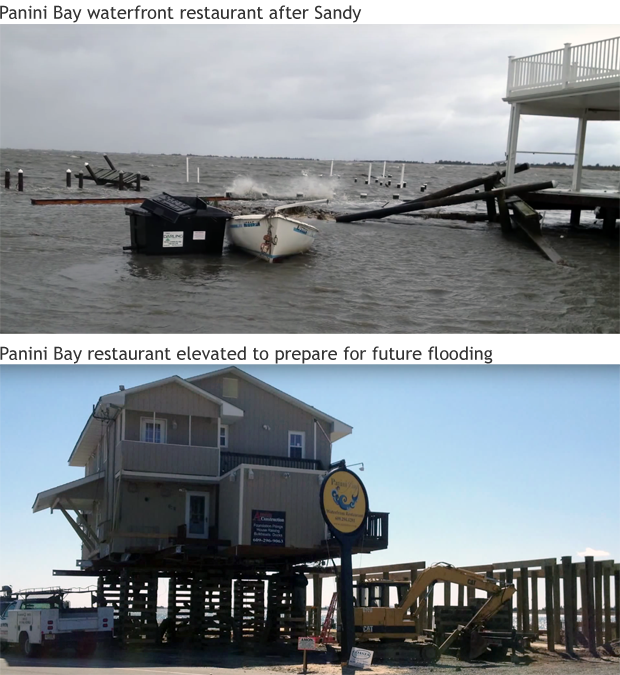
Small business owner Iver Johnson’s restaurant on the New Jersey waterfront was devastated by Sandy in 2012. Given the increasing risk of similar events due to sea level rise, Johnson rebuilt for resilience: raising the building 3 feet above the FEMA base flood elevation. Photos by Iver Johnson.
Extreme event attribution studies also have scientific value. They offer climate experts a chance to test and improve how their models simulate different kinds of extreme weather events. The more realistically models reproduce extreme weather events, the more we can trust them to provide helpful information on what the future may hold.
Another, more speculative, possibility is that over time, conducting such studies will identify a set of best practices in attribution research that lawyers and judges could apply in cases where the court needs to settle questions of liability for the costs or harm caused by an extreme event that may have been influenced by global warming and climate change.
What can extreme event attribution tell us?
Depending on the type of analysis, an extreme event attribution study can tell us whether global warming made (or will make) an event more likely than it would have been without the rise in greenhouse gases from burning fossil fuels. It can tell us if the average number of years between similar events is shorter or longer than it used to be. It can tell us what the risk is for a given extreme weather event and if and how much global warming has increased that risk.
Sometimes, extreme event attribution studies can also tell us how global warming may have added to the severity of an extreme event. How much hotter a heat wave would have been if greenhouse gases weren’t trapping so much extra heat. How much less rain would have fallen in a thousand-year downpour if rising temperatures hadn’t boosted the amount of water vapor in the air. How much lower the storm surge from a hurricane would have been if it hadn’t been for sea level rise due to global warming.
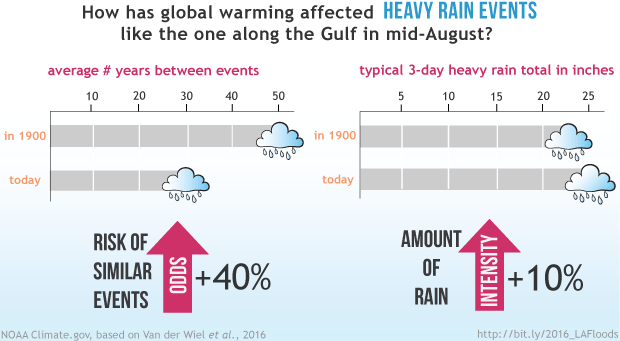
In mid-August 2016, a slow moving storm dumped more than two feet of rain in parts of southern Louisiana, forcing tens of thousands of people to evacuate and taking the lives of at least a dozen citizens. An attribution analysis found that the statistical return period for extreme rain events of that magnitude has dropped from an average of 50 years to 30 years due to global warming from greenhouse gases. And the amount of rain that would have fallen during a typical 30-year event in 1900 would have been 10% less than a similar event today, for example, 23 inches instead of 25. Graphic by NOAA Climate.gov, based on Van der Wiel, et al., 2016.
What can’t an extreme event attribution tell us?
It can’t tell us whether global warming “caused” a specific event. When most people ask if something caused something else—did global warming cause the Louisiana floods?—they want a yes or no answer. But with global warming and extreme events, it’s not a yes/no question.
Instead, it’s always a question of whether global warming added to the existing mix of ingredients that already make extreme weather happen. Global warming may be a cause for an event, but not the cause—at least not yet.
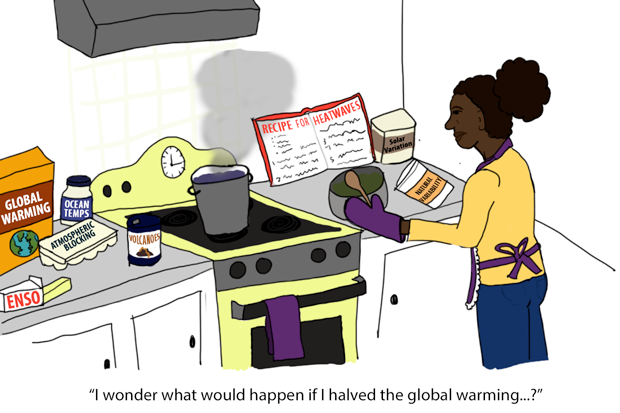
The recipe for any extreme event has multiple ingredients. Extreme event attribution uses historical observations and high-resolution climate models to figure out how much—if any—global warming went into the recipe. NOAA Climate.gov comic by Emily Greenhalgh.
How does an extreme event attribution study work?
Many extreme event attribution studies start by setting precise criteria for what made the event extreme and then checking the historical record for evidence of a change in the frequency or intensity of events that meet those criteria. Most studies also involve computer models in one of two ways:
- combined with historical observations and real world climate forcings (including greenhouse gas emissions) to re-create a seamless timeline of extreme events that extends from the poorly observed past, through the present, and into the future;
- or to create opposing virtual worlds—one with and one without the rise in greenhouse gases that has warmed Earth’s surface over the past century or more.
How do experts define an extreme event?
One way to put an extreme event into context is to put the entire range of historical observations of a type of extreme event in order from smallest to largest and then divide the range into percentiles (brackets). Scientists may then call an event that falls in the top or bottom bracket “extreme.”
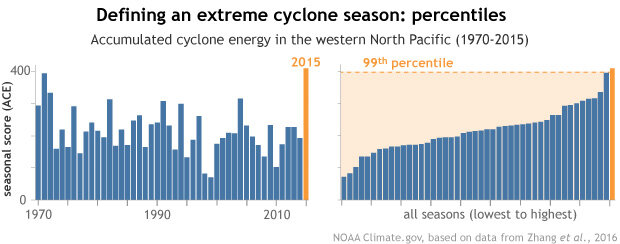
In the 2016 issue of Explaining Extreme Events from a Climate Perspective, climate scientists used percentiles to classify the extremely active 2015 cyclone (hurricane) season in the western North Pacific. (left) Each season was given an “accumulated cyclone energy” score that accounted for storm intensity and duration. (right) Sorting the scores from lowest to highest shows that 2015’s score of more than 400 (orange bar) was a “99th percentile” event: 99% of scores in the historical record were lower than 2015. Graph based on “best track” data from the Shanghai Typhoon Institute (STI) provided by Wei Zhang.
Scientists may also describe the severity of an extreme event in terms of “sigmas,” which is a term from statistics that describes how far an individual observation is from the average of all the values in a data set. Sigma is shorthand for “standard deviation;” it comes from the fact that statisticians use the Greek letter sigma to represent standard deviation in equations.
Sigmas are used to describe the range of natural variability in a given climate or weather characteristic. For most types of climate data, there are many more observations close to the average (within 1 or 2 sigmas) than there are far away. So, if a climate expert describes a heavy rain event as a “5-sigma” event, she is talking about rainfall so extreme that it was 5 standard deviations away from the average rainfall for that location for a given period of time—way out at the tail end of the range of all values that have been observed.
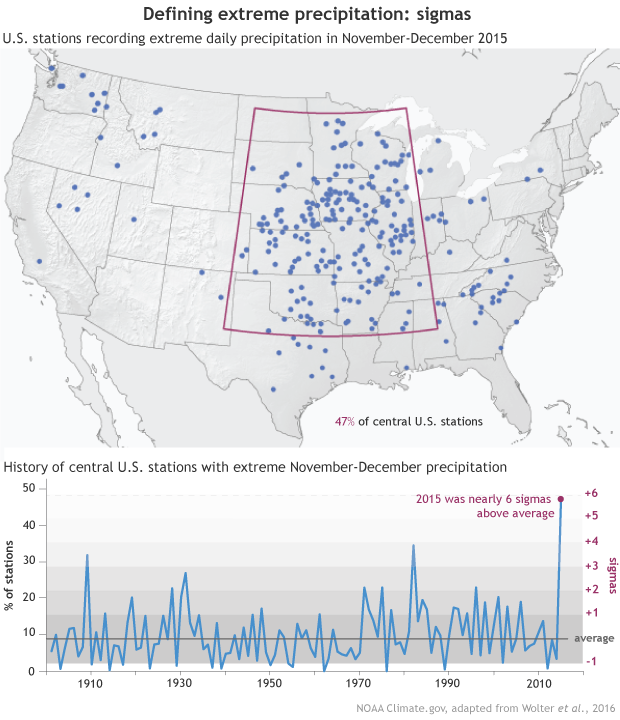
Sigmas are a way of describing the range of natural variability in a climate characteristic. (map) In 2015, nearly half of central U.S. stations with at least a 100-year history recorded extreme precipitation in November-December according to a NOAA analysis. (graph) More than half of the years on record are within plus or minus 1 sigma (darkest shading) of the average (gray line). Only a handful of years are outside of 2 sigmas. At nearly +6 sigmas from average, the 2015 season (purple dot) was far outside the range of normal variability. NOAA Climate.gov graphic adapted from Figures A1.1(h) and A1.2 (e) in Wolter et al., 2016.
Another way of defining an extreme event is by describing the probability of occurrence in a given span of time. Based on the observations we have, experts can use statistics to estimate the range of all possible events that we would eventually expect to observe if our data record were long enough. From this range of all possible values, they can pinpoint how frequently a particular value would be expected to occur within a given amount of time—its average return period, or recurrence interval.
Based on the statistical estimate, they can also identify the size of event that has a given probability of occurring. For example, they may define an “extreme drought event” as a streamflow so low that, given a long enough history of observations, we’d expect that water level to occur in just 1% of the values in the record. That’s the same thing as saying that each year, the chances for such an extreme drought are 1%, or 1 in a hundred, which is where the expression “100-year event” comes from.
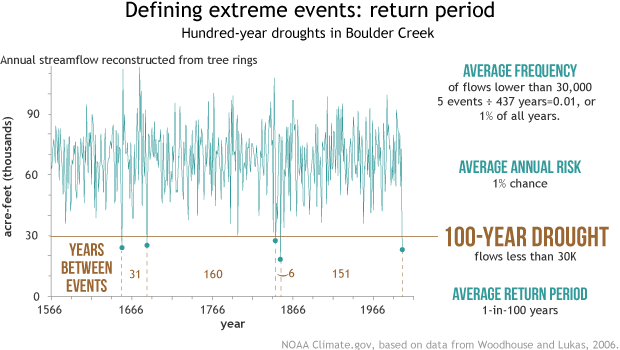
A history of 100-year droughts in Boulder Creek based on tree-ring data. Annual streamflows (green line) less than 30,000 acre-feet (brown line) occurred in just 1% of the years in the record. That’s 1-in-100 years on average, even though the actual number of years between events ranged from 6 to 160.
If a town experiences a hundred-year flood, are they safe for another hundred years?
Unfortunately, no. The concept of a “hundred-year flood” or a “fifty-year blizzard” are average return periods based on the likelihood (statistical probability) of an event of a certain size or severity happening over the span of hundreds of years.
Return periods are not a literal count of the number of years that have passed between similarly extreme events, nor are they a guarantee that a given number of years will pass before a similar event happens again. Regardless of when the last 100-year event was, there is a 1% chance of a 100-year event every year.
So what does a hundred-year event mean?
A 1-in-100-year event means an event is so extreme that it has only a 1% chance (1 divided by 100) of happening in any given year. A thousand-year event has a 0.1% chance of happening in any single year (1 divided 1,000).
The risk that a 100-year event will happen this year, or next year, or any single year is low: 1% chance that it will happen, 99% chance that it won’t. But the chance that it will happen within a given 20-year period is 18%. Within any 50-year period, 40%. Within any 100-year period, 63%. By the time 500 years have passed, there’s less than a 1% chance that such an event won’t have happened.
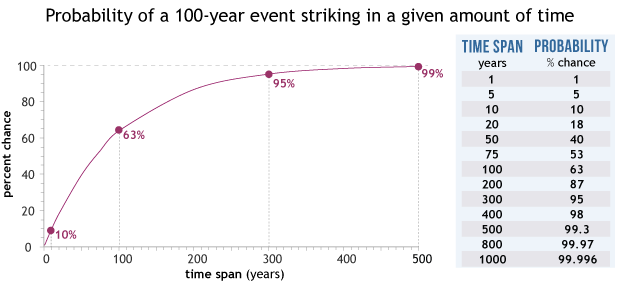
By definition, the probability that a 100-year event will occur in any single year is 1%. That means the probability that it won’t happen that year is 99% (All possible outcomes must add up to 100%). The probability of a 100-year event happening in any given period of time is 100% minus the probability of it not happening that many years in a row (99% multiplied by itself that number of times in a row). NOAA Climate.gov graphic.
How does an attribution study detect whether a kind of extreme weather event has changed over time?
Attribution analyses generally involve splitting the historical record (or model-simulated histories) into two or more time periods and testing for statistically significant differences in extreme events between earlier periods, when the influence of global warming was weaker, and recent periods, when its influence is stronger.
To test for changes in frequency, scientists can set a specific, absolute threshold for an extreme event—25 inches or more of rain in two days, or 3 consecutive days with overnight temperatures above 85 degrees F—and then test whether there is a difference in the number of events that meet that threshold in different time periods.
Other times experts may run the flip side of that analysis. They define an extreme event based on a conceptual threshold. An “extreme drought” might be defined as “the lowest 2% of seasonal rainfall totals.” Then experts would look to see if what qualifies as the lowest 2% in the beginning of the historical record is significantly different from what qualifies as the lowest 2% at the end of the record. These conceptual thresholds are useful when experts want to simultaneously compare extreme events in different locations that may have different climates.
Why do attribution studies require models?
Observations can only tell us if there’s been a detectable change in the intensity or frequency of an event; they can’t tell us what caused a change. Previous research on overall trends may strongly suggest that global warming is the reason for the change, but models allow scientists to test whether there is a plausible physical link between the climate heating due to greenhouse gases and the behavior of a particular kind of extreme event.
To uncover a physical link, climate experts turn to models. One strategy is to create opposing virtual worlds that are identical except that one world resembles reality—including human-caused greenhouse gas emissions—while the other world (the counterfactual) has the human-caused greenhouse gas emissions removed.
The models generate hundreds or thousands of timelines for each world, and scientists compare the frequency and intensity of extreme events in each set of timelines. Because all other characteristics of these worlds are the same except for greenhouse gases, scientists can be confident that global warming is likely responsible for any differences.

In a recent extreme event study of the 2015 cyclone season in the North Pacific, NOAA scientists used models to compare cyclone activity in the middle of the twentieth century to the middle of the twenty-first century. (top) The 2015 season was a 99th percentile event. (middle) Model projections of seasonal scores of accumulated cyclone energy in the 1940s (dark blue line) and the 2050s (light blue line) showt he changing frequency of 99th percentile events. (bottom) Global warming due to rising greenhouse gases has increased the risk of an extreme North Pacific hurricane season like 2015’s by a factor of 5. NOAA Climate.gov graphic adapted from Zhang et al., 2016.
A second strategy is to use models to recreate a more complete history of extreme events than the actual historical record provides. Models are constrained by all available observations and real-world climate influences, and then scientists have the models re-create a seamless history of extreme events that reaches from the present back into the poorly observed preindustrial era (usually 1860).
With this model-assisted historical timeline, climate experts have enough data to statistically test if and how much the frequency or strength of a type of extreme event has changed over time.
Why are some events more difficult than others to connect to global warming?
Attribution analysis depends on ‘three pillars’ of scientific knowledge:
- The quality of the observational record,
- The ability of models to simulate a given type of extreme event, and
- How well we understand the physical processes that create an event and how global warming may influence those processes.
For event types where all three of these pillars are strong, our confidence in the results is higher. If any of the three pillars is weak, it becomes harder to conduct an attribution study, and our confidence in the results is lower. In general, scientists have the highest confidence for heat events because all three of the pillars are strong. Observational records are long and of high quality, models effectively simulate heat events, and the mechanisms of how climate change will impact heat events is well understood.
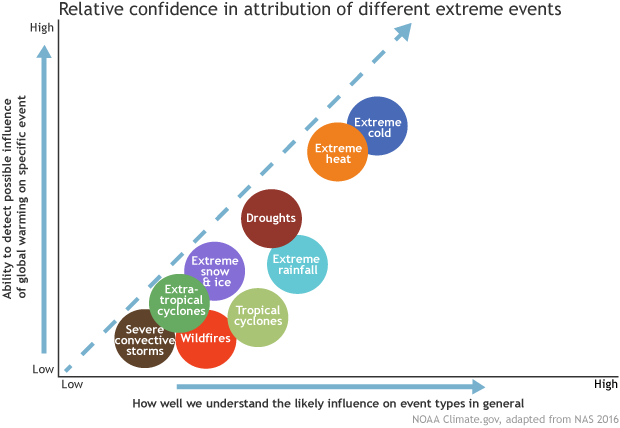
Scientists' confidence in studies to detect the influence of global warming on a specific extreme event (vertical axis) depends on the level of scientific knowledge about how global warming will affect the atmospheric processes that produce those types of events. Graphic adapted from Figure 4.7 in NAS 2016.
In contrast, our confidence in attribution studies on tornadoes is much lower. The observational record is not consistent and relatively short, the models remain inconclusive as to replicating tornado activity, and our understanding of how global warming and climate change will influence the different atmospheric processes that produce tornadoes (wind shear, for example) is more limited.
What’s been learned in the past five years of research on extreme weather events?
Since the first attribution analysis looking at the 2003 European heat wave was published in 2004, the science of event attribution has come a long way. The diversity of event types we can analyze has grown, our statements about risk have become more precise, and we are more successful at separating natural influences from human influences.
Since 2011 more than 100 attribution papers have been published in the annual “Explaining Extreme Events from a Climate Perspective” report, published as a special supplement of the Bulletin of the American Meteorological Society (BAMS). The type of events that are now examined has expanded beyond heat and precipitation to include many other event types: tropical cyclones, winter storms, storm surge, tidal flooding, ‘snowpack droughts’, wildfires, and sea ice extent.
In addition, scientists are increasingly able to distinguish evidence of human-induced climate change from natural variability. For heat events in particular, the skill with which other drivers like El Nino can be separated from long-term global warming has increased significantly.
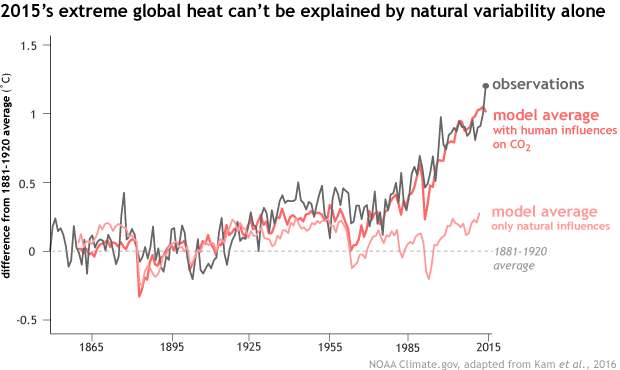
An analysis of the planet's extreme heat in 2015 found that almost all of the increased risk for such an extremely hot year could be attributed to global warming due to rising greenhouse gases and other human-caused factors. More than 99% of the increased risk was attributable to human causes according to an ensemble analysis of eight models. Model simulations that included only natural influences on climate (pink line) diverge sharply from observed surface temperatures (charcoal line) around 1970. By 2015 (gray dot), only the model average that included rising carbon dioxide levels (red line) resembled the real world. NOAA Climate.gov graphic adapted from Figure A2.1(e) in Kam et al., 2016.
Perhaps one of the most important advancements in the field has been the move from generalized statements about an event generally becoming ‘more’ or ‘less’ risky to more quantitative assessments of the change in risk.
One challenge that has emerged, however, is accounting for the possible influence on extreme events of natural patterns that operate on the span of decades, such as the Pacific Decadal Oscillation and the Atlantic Multidecadal Oscillation. Such patterns may only go through a few complete cycles over the span of the historical records, which increases uncertainty in their possible influence on extreme events. In addition, experts are still assessing whether climate models simulate these patterns correctly.
What does it mean if two studies disagree about whether global warming influenced an event?
While it might mean that one of the studies is flawed, usually, what appears to be a disagreement is simply a matter of experts choosing to investigate different aspects of an event or to define the extreme event in different ways.
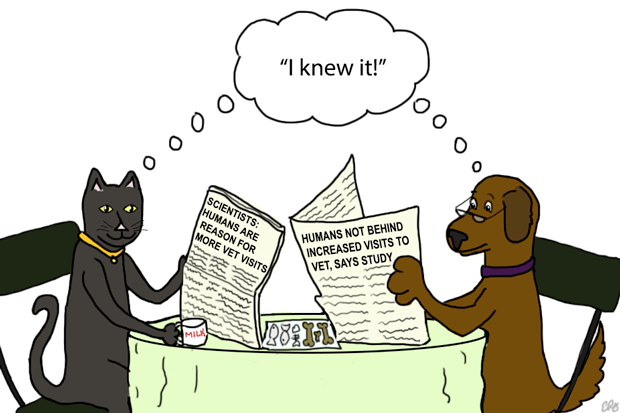
Two studies of the same extreme event may come to different conclusions about the influence of global warming because each may investigate a different aspect of the event. That doesn't mean they contradict each other. NOAA Climate.gov cartoon.
Decisions about what criteria to use to define “extreme,” how large or small an area to consider, the exact time periods to include, and many other things can lead to seemingly conflicting conclusions about what is fundamentally the same event. An “extreme drought” could be defined strictly based on precipitation totals, for example, or it could be defined by something like soil moisture, which is directly influenced by daily high and low temperature.
Or one study may choose to evaluate the strength, or severity of an event, while another may choose to study how often such an event is likely to recur in a given length of time. Global warming may make an event more likely, but not stronger, or vice versa. The news headline for one study would be “Global warming didn’t influence event X!” The headline for the other would be “Global warming partly to blame for extreme event X!”
If a study fails to find the fingerprint of global warming on an extreme event, does that prove it wasn’t a factor?
Not necessarily. It may mean that the historical record isn’t complete enough to allow statistically robust tests. It may mean that climate models aren’t capable of generating realistic simulations of the event, which reduces scientists’ confidence in the model results. It may also be that global warming influenced an event in a way that was beyond the scope of the definition of “extreme event” that scientists used in their analysis.
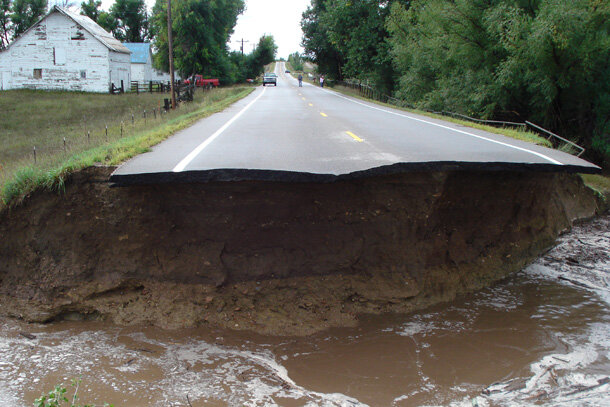
A county road washed out by flash flooding near Berthoud, Colorado, in September 2013, during a record-breaking rainfall event. A NOAA study of the event concluded that rising atmospheric humidity due to global warming had not made similar events along the Colorado Front Range more common. Photo © Lornay Hansen/CIRES.
Consider all the facets of a devastating landfalling hurricane, for example, which presents a variety of storm-related hazards—wind, storm surge, inland flooding—each of which may or may not be influenced by global warming. A single study is rarely going to investigate every aspect of an extreme event all at once, which leaves open the possibility that global warming influenced a different aspect of the event.
If global warming has fundamentally changed the entire climate system, then isn’t every weather event affected by climate change?
Different scientists have given different answers to this question. Some say yes, that all weather events are now occurring in a warmer and wetter atmosphere, and so everything that happens—all weather events, extreme or otherwise—are being influenced by that change.
Others say no, we can’t say every event has been influenced by global warming. They use an analogy from the world of sports. A ballplayer hits an average of 5 home runs a season in the minors. He moves up to the majors and starts taking steroids. His home run average goes up to 8 per season. Statistically speaking, five of those 8 he would have hit anyway, so we can’t say that every home run he hit was affected by steroids, just like we can’t say that every extreme weather event has been affected by global warming.
Many climate experts seem to agree, however, that such a general question—did global warming affect a particular extreme weather event?—isn’t especially scientifically interesting or useful. What’s useful—for improving our understanding of the climate system and guiding decisions—is being able to say specifically how and how much global warming affected an event at a particular time and place. For that, we need extreme event attribution.
What are the major hurdles for scientists trying to do extreme event attribution?
Extreme event attribution is challenged by the fact that the events themselves are rare and our observational records are short, that weather events always have multiple contributing causes, and that they occur on regional and local scales that are scientifically and computationally challenging for climate models to handle.
Attribution analyses depend on statistical tests for differences, and the fewer events you have, the greater the range of uncertainty about the conclusions. Because extreme events are rare, analyses that depend on observations have a large range of uncertainty.
Models allow scientists to create virtual Earths and to generate hundreds or thousands of hypothetical timelines, each with it’s own unique collection of extreme events. Having more events for statistical testing decreases the range of uncertainty in the results.
When it comes to simulating the impact of greenhouse gases on extreme weather events, however, global climate models have their own challenges. For starters, global models were designed to predict how average climate conditions over large areas would respond to average global increases in carbon dioxide. Most of these global models do a poor job of simulating small-scale, individual extreme weather events.
Those limitations mean that for extreme event attribution studies, scientists must usually turn to high-resolution models to better capture local extremes. These high-resolution models introduce challenges of their own. Just like with digital photos, the more detailed the virtual picture of Earth becomes, the more computer processing power and storage the simulations require, and the longer it takes to generate the simulations.
These processing constraints limit the number of years that can be analyzed and the number of climate variables that can be saved and stored for analysis. As computing power increases and storage becomes cheaper, the amount of data available for attribution analysis will grow.
References and additional reading
Committee on Extreme Weather Events and Climate Change Attribution, Board on Atmospheric Sciences and Climate, Division on Earth and Life Studies, & National Academies of Sciences, Engineering, and Medicine. (2016). Attribution of Extreme Weather Events in the Context of Climate Change. Washington, D.C.: National Academies Press. Retrieved from http://www.nap.edu/catalog/21852
IPCC Special Report on Extreme Events
Kam, J., Knutson, T., Zeng, F., and Wittenberg, T. (2016). Multimodel assessment of anthropogenic influence on record global and regional warmth during 2015. [in "Explaining Extremes of 2015 from a Climate Perspective"] Bull. Amer. Meteor. Soc., S4-8.
Stott, et al. 2011. Attribution of Weather and Climate-Related Extreme Events.
The U.S. National Climate Assessment's findings on extreme weather
Van der Wiel, K., Kapnick, S., Jan van Oldenborgh, G., Whan, K., and Philip, S., Vecchi, G., Singh, R., Arrighi, J., and Cullen, H. (2016). Rapid attribution of the August 2016 floodinducing extreme precipitation in south Louisiana to climate change. Hydrol. Earth Syst. Sci. Discuss., doi:10.5194/hess-2016-448, 2016
Wolter, K., M. Hoerling, J.K. Eischeid, and L. Cheng, 2016: What History Tells us about 2015 US Daily Rainfall Extremes [in "Explaining Extremes of 2015 from a Climate Perspective"]. Bull. Amer. Meteor. Soc., 97 (12), S9-S13. DOI:10.1175/BAMS-D-16-0166.1
Woodhouse, C., and J. Lukas. Streamflow Reconstructions for Boulder Creek, South Boulder Creek, and the Colorado River. Report to City of Boulder and Hydrosphere Resource Consultants, January 2006.
Zhang, W., G.A. Vecchi, H. Murakami, G. Villarini, T. Delworth, K. Paffendorf, R. Gudgel, L. Jia, F. Zeng, and X. Yang, Attributing the Extreme 2015 Accumulated Cyclone Energy in the Western North Pacific to Anthropogenic Forcing.[in "Explaining Extremes of 2015 from a Climate Perspective"] Bull. Amer. Meteor. Soc., S6-15.