
From reindeer to regional temperature patterns, from sea ice age to Greenland surface melt, the Arctic Report Card is a yearly assessment of the Arctic's physical and biological systems and how they are changing. This collection of visual highlights from the 2013 report is a story of the Arctic in pictures.
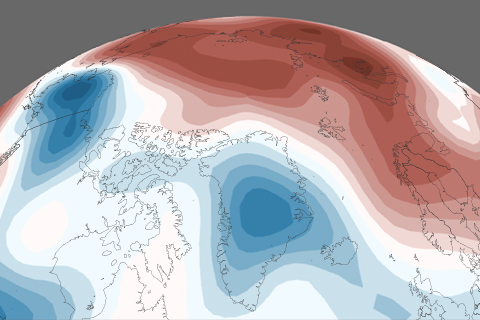
Since the mid-1960s, the Arctic has warmed about 3.6°F (2.0°C)—more than double the amount of warming in lower latitudes. In 2012 (the last complete calendar year available at the time scientists began working on the 2013 Arctic Report Card), the annual average temperature was the sixth warmest on record.
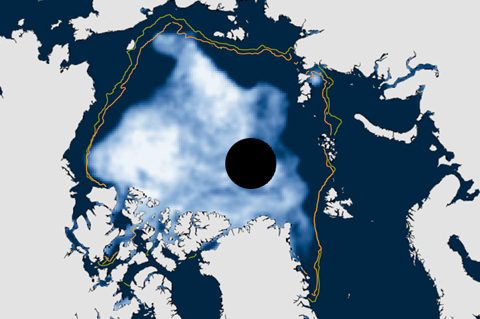
To be consistent with NOAA's use of 30-year periods for the official "climate normals," the National Snow and Ice Data Center switched its baseline period for sea ice analyses from 1979-2000 to 1981-2010. Compared to the new normal, the low ice conditions of the recent past will appear less abnormal than they used to.
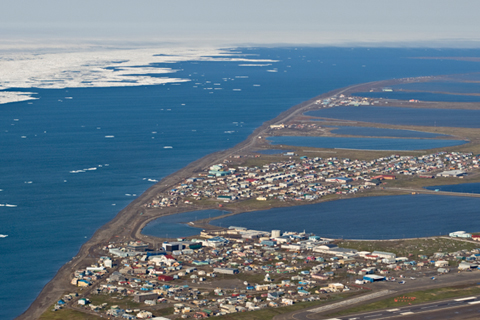
Since 2002, Octobers in Barrow, Alaska—America's northernmost town—are regularly near the warmest on record, thanks to the retreat of sea ice. The warming hinders traditional hunting activities, makes the town more vulnerable to storm surge flooding, and thaws the frozen ground to greater depths, which destabilizes roads, house foundations, and traditional underground freezers.
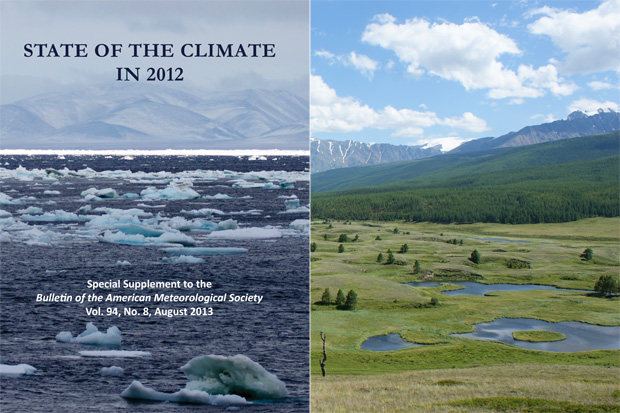
From record-low Arctic sea ice to the highest global sea level of the modern record, the 2012 State of the Climate report provides a complete rundown on the state of Earth's climate and how it is changing.
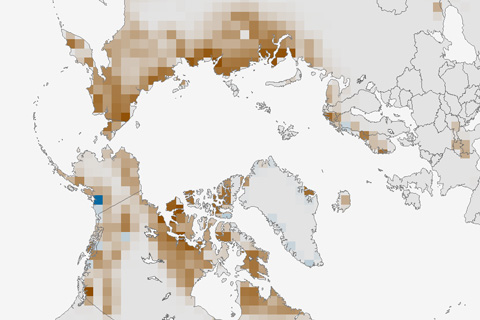
The extent of snow-covered ground in the Northern Hemisphere at the end of the cold season (June) hit a record low. Annual average snow cover extent has not exceeded the long-term average even once since 2003. Between 1979 and 2011, the snow cover in June is declining even faster than the end-of-summer Arctic sea ice extent.
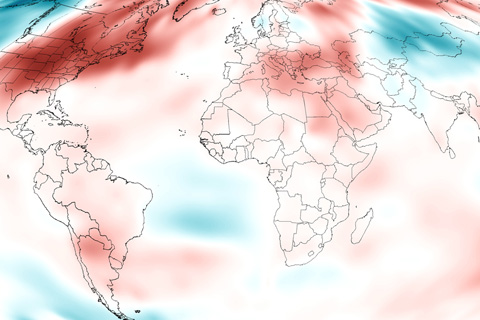
Since 1976, every year has been warmer than the long-term average, and 2012 continued the trend: the global surface temperature ranked among the top 10 warmest years on record.
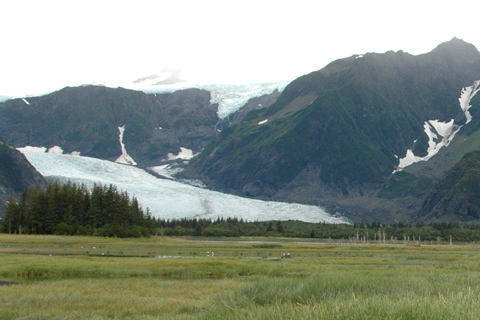
Glacier mass balance in 2011 (the most recent year for which worldwide analysis is complete) was negative, and preliminary data indicate that 2012 will probably be the 22nd consecutive year of net losses in glacier mass. Between 1980 and 2011, glaciers around the world lost the water equivalent of 15.7 meters. That would be like slicing a roughly 17-meter-thick slab off the top of the average glacier and repeating that exercise worldwide.

Global average sea level in 2012 was 1.4 inches above the 1993-2010 average, which was the highest yearly average in the satellite record. Sea level has been rising over the past century, and the pace has increased in recent decades.
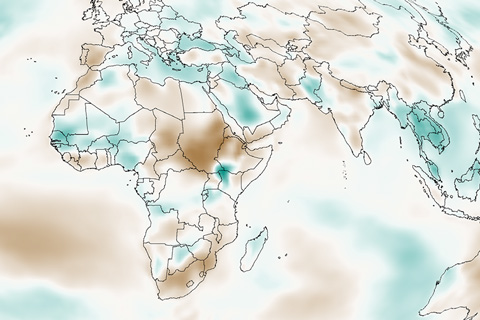
Earth's atmosphere includes billions and billions of gallons of evaporated water: in fact, water vapor is Earth's most abundant greenhouse gas.