2015 State of the Climate: El Niño came, saw, and conquered
A record-smashing hurricane season in the central North Pacific. Water rationing in Puerto Rico. The biggest one-year jump in atmospheric carbon dioxide concentrations on record. Severe drought in Ethiopia. The hottest global surface temperature—by one of the largest margins—on record.
Those are just a few of 2015’s major climate happenings documented in the recently released State of the Climate 2015 report from NOAA and the American Meteorological Society. While the events were scattered across the globe, they all had one thing in common: they were all connected to one of the three strongest El Ninõs in the historical record.
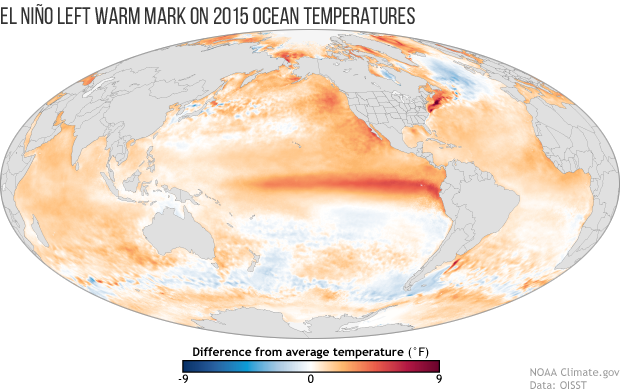
Worldwide sea surface temperatures in 2015 compared to the 1981-2010 average. A dark orange swath through the tropical Pacific Ocean in image center shows the year-long influence of El Niño. Map by NOAA Climate.gov, based on OISST data from NCEI.
A Pacific pattern with a global echo
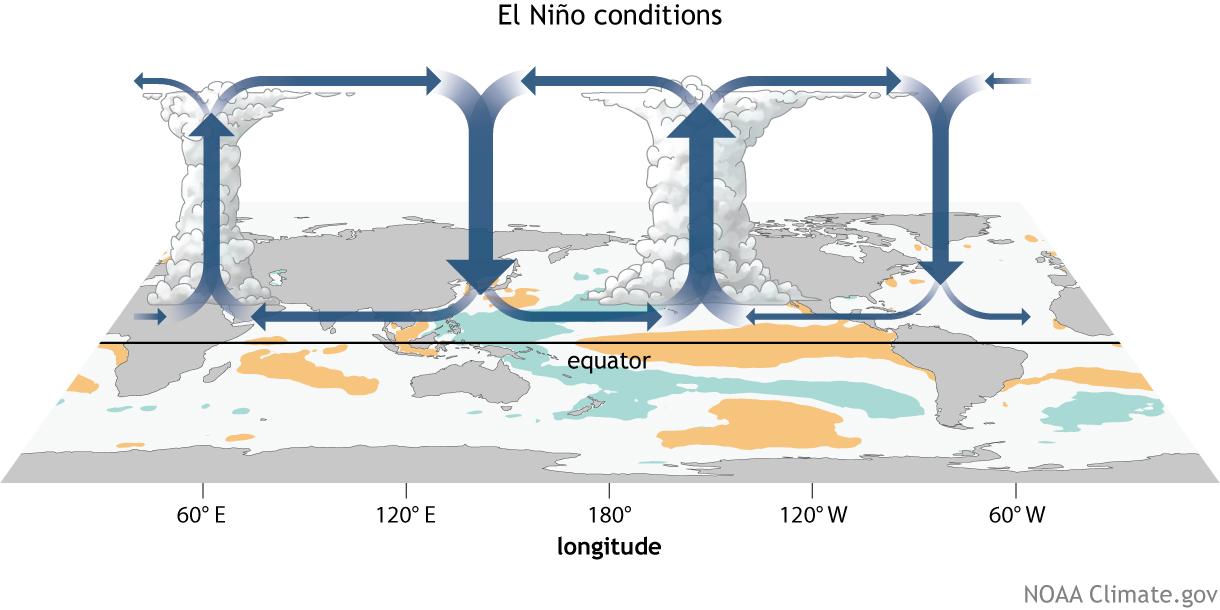
El Niño is the warm phase of a natural climate pattern called “ENSO,” which is short for El Niño-Southern Oscillation. During El Niño, the prevailing winds near the equator in the Pacific relax. Surface waters in the central and eastern Pacific warm up. A major hotspot of tropical rainfall and convection (rising air) develops over the warm waters.
The warm up for the 2015 El Niño event actually began in 2014. Monthly sea surface temperatures in a key ENSO-monitoring region hit the El Niño threshold—0.5°C above average—in October 2014 and remained elevated through winter. But the atmosphere didn’t fully start cooperating until March 2015, when NOAA forecasters declared El Niño officially underway.
By December 2015*, however, disruptions in temperature, rainfall, and surface air pressure across the tropical Pacific were on par with two of the strongest El Niños in the historical record: 1982 and 1997.
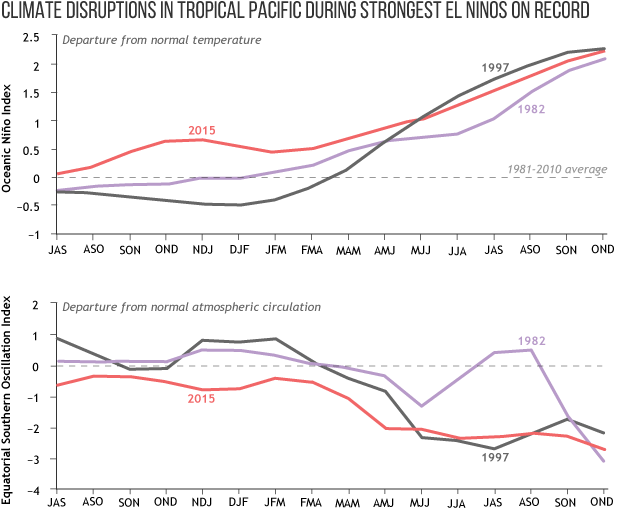
The build up of ocean and atmosphere disruptions in the months leading up to the peaks of the three strongest El Niños in the historical record 1982-82 (purple), 1997-98 (charcoal), and 2015-16 (pink). NOAA Climate.gov graph, adapted from Figure 4.1 in State of the Climate in 2015.
Because of the Pacific Ocean’s tremendous size, disturbances there can lead to climate disturbances around the globe. To the rest of the global atmosphere, the arrival of El Niño in the Pacific is like a giant ringing a bell so loudly that it knocks the dishes off the shelves in a house down the street. The atmosphere hears the echoes from El Niño from thousands of miles away.
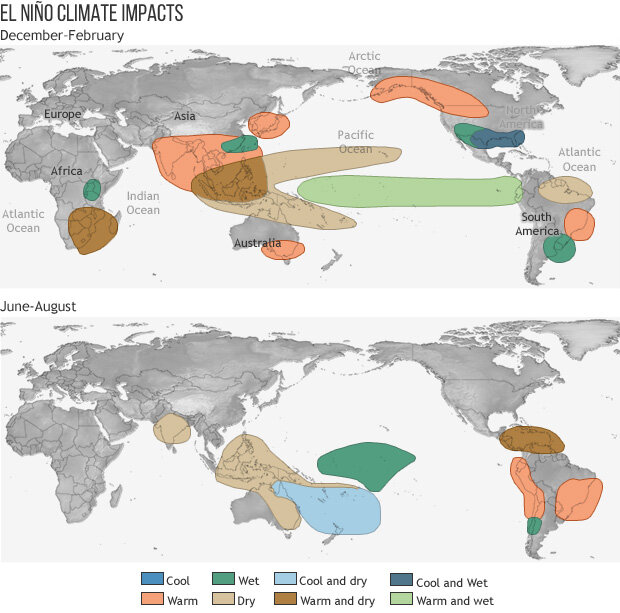
These maps show winter and summer global ENSO impacts.
Some of the 2015 El Niño’s loudest “echoes”
Every El Niño is somewhat different, even strong ones. Still, many regions experienced climate extremes and anomalies in 2015 that are typical of El Niño years. Pulled from the State of the Climate report, here are some of the loudest echoes of the 2015 El Niño.
Record-smashing hurricane season in the central North Pacific
Sixteen tropical cyclones formed in or passed through the unusually warm central Pacific hurricane basin in 2015. That’s more than 3 times the 1981–2010 average of 4.7 cyclones per season, and 4 more than the previous record of 12, set in 1992 (also an El Niño year). In late August, the basin sustained three Category 4 hurricanes at the same time, which was a first, not just for the central Pacific basin, but for any basin during the modern record.
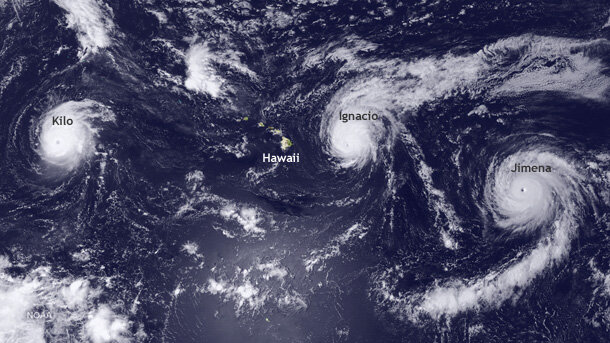
Satellite image of record-breaking trio of Pacific hurricanes, Kilo, Ignacio, and Jimena on August 31, 2015. NOAA GOES West image from NOAA EVL.
500-year drought in the Caribbean
Temperatures were high and rainfall was low across the entire Caribbean in 2015. Ten island nations experienced severe drought. Emergency water rationing occurred in St. Lucia and in San Juan, the capital of Puerto Rico.
In Antigua, the 1-billion-gallon reservoir behind the Potworks Dam went dry. Sixty-five percent of the island’s farmers went out of business. Rainfall deficits were the largest on record dating back to 1928. The return period for rainfall so low is estimated to be 1 in 500 years.
New global temperature record
The global average surface temperature in 2015 came in first in the race for warmest year on record, beating out the previous record—set in 2014—by 0.13°–0.18°C, depending on the datas et. This wasn’t just a new record for warmth, it was also the largest margin by which one year has beaten another since 1998 (which was also an El Niño year!).
Biggest one-year jump in atmospheric carbon dioxide levels at Mauna Loa
The global average carbon dioxide concentration at Mauna Loa Observatory made the biggest 1-year jump of the modern record: 3.1 parts per million. The previous largest annual jump in carbon dioxide that scientists observed at Mauna Loa (2.93 ppm) was in 1998 during another strong El Niño.
El Niño often leads to an expansion of global drought area (less plant growth and carbon dioxide uptake), an increase in tropical forest fires (release of stored carbon from wood and leaves), and other landscape changes that boost atmospheric carbon dioxide levels. Among the major contributors in 2015 were rampant forest fires in Indonesia.
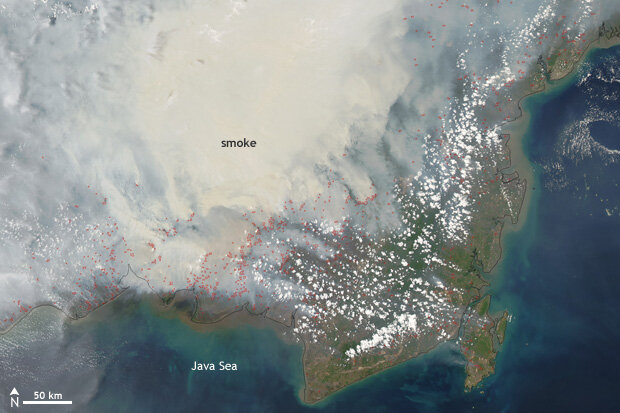
A pall of brownish-gray smoke obscured the island of Borneo in this satellite image from October 19, 2015. Locations where the satellite detected active fire are outlined in red. Image from NASA Earth Observatory.
The overactive fire season was attributed to El Niño-linked drought, which made degraded forests surrounding agricultural lands very flammable. When seasonal agricultural burning got underway, the fires spread into surrounding forests, causing an environmental and public health emergency.
Drought in Ethiopia
Few places have as long and devastating a history with drought and famine as Ethiopia, and El Niño tends to raise the likelihood for failed rainy seasons and drought. In 2015, northern, central, and southeastern Ethiopian highlands received 50%–90% of their normal rainfall. In the northeastern highlands, it was as little as 30%. More than 8 million people required food aid as a result of lost crops.
*This article is based on analysis and details of E Niño published in the 2015 State of the Climate report, which covers climate during the calendar year. The 2015 El Niño continued through winter and spring of 2016. More information about the event in 2016 is available in our ENSO blog.
References
Benedetti, A., F. Di Giuseppe, J. Flemming, A. Inness, M. Parrington, S. Rémy, and J. R. Ziemke. (2015) Atmospheric composition changes due to the extreme 2015 Indonesian fire season triggered by El Niño. Sidebar 2.2. [State of the Climate 2015, Chapter 2 (Global climates). K. M. Willett, D. F. Hurst, R. J. H. Dunn, and A. H. Dolman.]
Bell, G. D., M. Halpert, and M. l’Heureux. (2015) ENSO and the Tropical Pacific. In State of the Climate 2015, Chapter 4: The Tropics. H. J. Diamond and C.J. Schreck, Eds.
Mekonnen, A., J.A. Renwick, and A. Sanchez-Lugo, Eds. Chapter 7: Regional Climates. In State of the Climate 2015, Blunden, J., and D.Arndt, Eds.