July 2023 El Niño update: learning the steps
The chance that our young El Niño will continue through the winter is greater than 90%. Why are forecasters so confident? What are the chances of a strong El Niño? And what effect does El Niño have on global climate patterns? We have a lot to talk about today, so let’s get to it!
Tumbling class
The Niño-3.4 Index, which measures the temperature of the surface of the central tropical Pacific Ocean, is our primary metric for El Niño. It was 0.8 °C (1.4 ˚ F) above the long-term average (long term = 1991–2020) in June, according to our most consistent dataset, ERSSTv5. This is comfortably above the El Niño threshold of 0.5 °C.
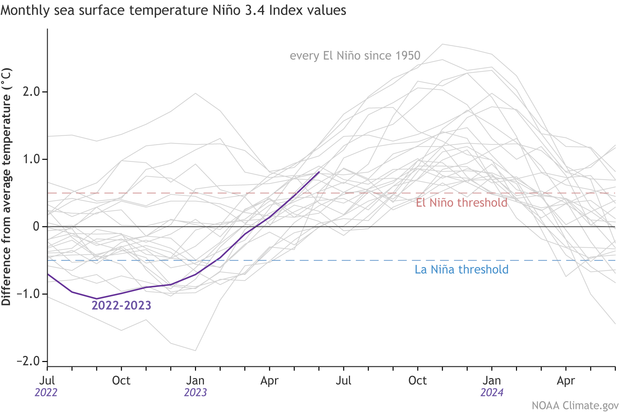
The three-month-average Niño-3.4 Index, the Oceanic Niño Index (ONI), was 0.5 °C for April–June 2023. In order to qualify as an El Niño year and be colored red in our historical record, the ONI must be at or above the threshold for at least 5 three-month periods. In this case, El Niño conditions would need to last through at least the August–October average to qualify. We have a confident forecast for this… but I’m getting ahead of myself. Back to the present!
Middle school dance
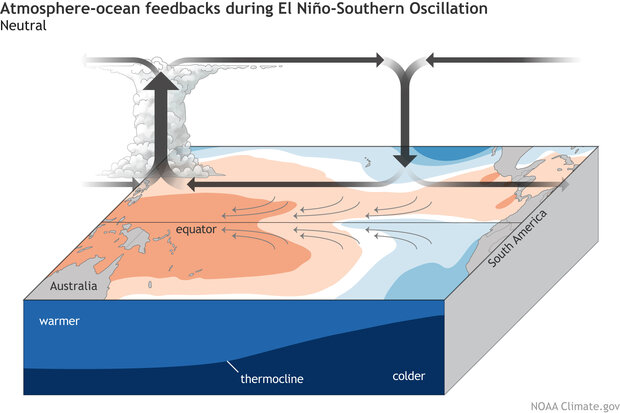
El Niño is a coupled climate pattern, meaning the changes in the ocean temperature are paired with changes in the atmosphere. These changes show up in the Walker circulation, the large-scale atmospheric circulation pattern over the tropical Pacific. The average Walker circulation is driven by the very warm waters in the far western Pacific and consists of rising air and storms over the far western Pacific and Indonesia, west-to-east winds aloft, descending air and dry conditions over the eastern Pacific, and the trade winds, east-to-west surface winds.
El Niño shifts this circulation by increasing the amount of rising air, clouds, and rain over those warmer-than-average waters in the central Pacific. The trade winds and the upper-level winds slow, and the overall circulation weakens. The weaker trade winds allow the surface to continue to warm, and a feedback mechanism is born. For more details on this feedback, check out Michelle’s excellent (and tasty) post.
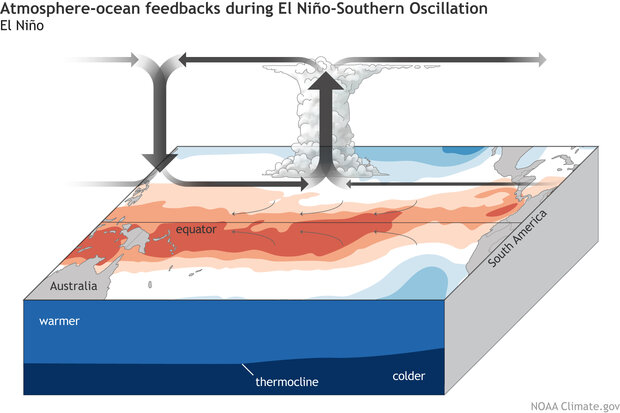
Evidence for the atmospheric part of El Niño includes changes in tropical Pacific winds and cloud patterns. At this early stage of El Niño, the atmospheric response is present, but still quite weak, especially relative to the oceanic anomalies. We did observe more rain and clouds over the central Pacific and some drier conditions over Indonesia, which is typical for El Niño. Also, the Equatorial Southern Oscillation Index, a measure of the Walker circulation strength, was in the bottom quarter of all June values, so respectably negative (negative indicates weaker). However, stronger El Niño events are usually preceded by bursts of much weaker trade winds, but we haven’t seen much of those so far.
Winds and atmospheric conditions always fluctuate more from month to month than ocean surface temperatures, so this weak response isn’t a reason to doubt the forecast… yet. It’s still very likely that El Niño will continue at least through the end of the year, but this El Niño is taking place in the context of a very warm global ocean, and we don’t know how the warm globe will affect El Niño’s atmospheric conditions.
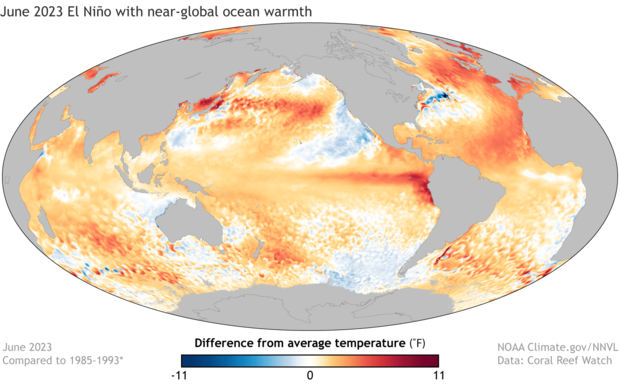
June 2023 sea surface temperature difference from the 1985-1993 average (details from Coral Reef Watch). Much of the global oceans are warmer than average. NOAA Climate.gov image from Data Snapshots.
One potential outcome is a weaker atmospheric response than we might otherwise expect. The strength of the atmospheric response is related to the pattern of sea surface temperature throughout the tropics. When El Niño is clearly the loudest voice in the room, as it was during the 1997–98 El Niño, the atmospheric response is clear. However, when the western Pacific and the rest of the tropics are also warm, the response may be more muddled. This outcome is important not just for El Niño itself, but also because many of El Niño’s impacts on global weather and climate patterns are communicated around the world via these atmospheric changes.
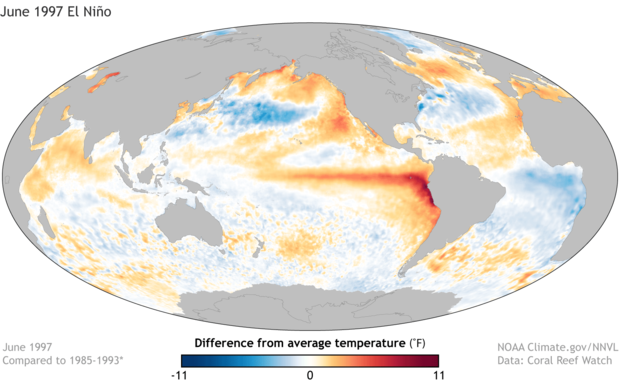
June 1997 sea surface temperature difference from the 1985-1993 average (details from Coral Reef Watch). El Niño's warmer-than-average pattern stands out clearly in the east-central Pacific. NOAA Climate.gov image from Data Snapshots.
The Nutcracker
Now it’s time to talk forecast. Our computer climate models are consistently predicting that El Niño will continue through the winter, providing a major source of confidence.
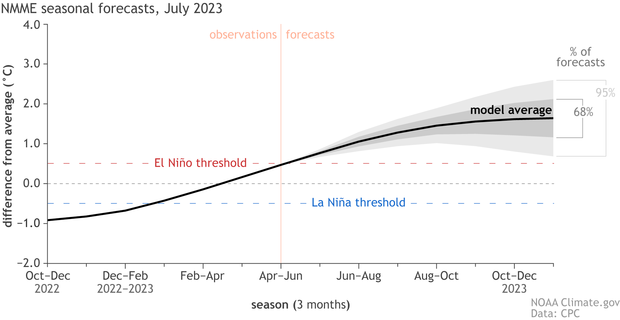
July 2023 climate model forecasts for the Niño-3.4 temperature anomaly in 2023 from the North American Multi-Model Ensemble (NMME). The black line shows the model forecast average; darker gray envelope shows the range of 68% of all model forecasts; lighter gray shows the range of 95% of all model forecasts. NOAA Climate.gov image based on a graph from Emily Becker.
Also, there is quite a lot of warmer-than-average water under the surface of the tropical Pacific. In fact, the temperature of the subsurface in June 2023 was the third-warmest June value in our record, which goes back to 1979. This warm subsurface will feed the surface for the next few months, helping to sustain El Niño conditions.
How about potential strength? El Niño’s maximum Niño-3.4 Index values, aka its peak, almost always occur in November–January. We estimate about an 80% chance that this El Niño will peak with a maximum Niño-3.4 Index of at least 1.0 °C, a 50% chance of at least 1.5 °C, and a 20% chance of above 2.0 °C. These thresholds are, respectively, how we categorize moderate, strong, and very strong El Niño events, but this is just an informal classification. Generally, the stronger the sea surface temperature anomaly, the stronger the atmospheric response, and the more consistent the pattern of El Niño’s remote impacts on rain and temperature patterns. However, as I mentioned above, the warm global ocean may complicate this relationship.
Touring production
That said, El Niño is still our best source of information for upcoming seasonal weather and climate, despite operating against a backdrop of higher global temperatures. El Niño’s impact on global precipitation and temperature patterns is strongest in the Northern Hemisphere winter, both because that’s when El Niño reaches its peak, and because the jet stream, which is influenced by El Niño, is a major player for winter weather.
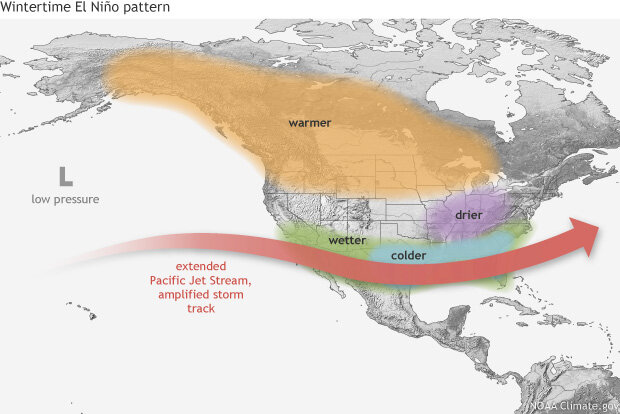
Typical impacts of El Niño on the jet stream and winter climate across the United States. NOAA Climate.gov map by Fiona Martin.
Other parts of the globe may see impacts before that. June-August dryness is common for India, the Maritime Continent, eastern Australia, and the Caribbean. Warmth is common in the Caribbean and parts of South America. And then there’s the hurricane seasons in both the eastern Pacific and Atlantic Oceans.
NOAA’s Climate Prediction Center prepares outlooks for upcoming seasons, which take El Niño and climate trends into account. Keep an eye on those maps for the patterns that forecasters think will be most likely later this season and for fall and winter.
Comments
Thank you!
Thank you for this amazing outlook you guys produce. Most welcomed in rural Argentina!
Keep it going!
Thanks for the kudos! The…
Thanks for the kudos! The encouragement keeps us motivated!
El Niño maps
It’s interesting to note that the maps showing where the warm water is and the cooler spots is reversed from 1997 to 2023 – that is, the cooler water is located next to the coast right now, and the 97 it was further out. I am wondering how that will affect this El Niño.
That's the million dollar…
That's the million dollar question at the moment. I agree that the North Pacific Ocean shows basically the opposite anomaly pattern compared to June 1997.
Keep in mind too that we might see changes afoot when we get closer to the winter months... During El Nino, the North Pacific jet stream tends to shift equatorward and extend eastward (more on a forthcoming blog post), which *could* create the conditions for more southerly flow (from south to north) along the West Coast of the U.S. That can then help reduce the cold water upwelling along the shores and warm the surface waters. We shall see.
Weak El Niño means Wisconsin
Weak El Niño means cold and snowy winter for Wisconsin which I’m hoping and California gets drought this winter. If California can get snow in La Niña and El Niño so can Wisconsin. I think El Niño interfere La Niña last winter so I think La Niña should ruin el.niño I am upset that El Niño is happening more than La Niña.
El Nino Winter
This is more likely a stronger than weaker El Nino, Why would you want to see California in a drought after three consecutive drought years? El Nino does not occur more often than La Ninas, Weve had three consecutive La Nina years and five la ninas in the last ten years, Weve only experienced three el ninos during that same time period
probability forecast
Can someone point to a explanation or provide one on how the probability of 3 things happening ("We estimate about an 80% chance that this El Niño will peak with a maximum Niño-3.4 Index of at least 1.0 °C, a 50% chance of at least 1.5 °C, and a 20% chance of above 2.0 °C.") add up to greater than 100%? 80%+50%+20% is 150%.
Thanks
The key is "at least 1.0C" …
The key is "at least 1.0C" ... which means these are probabilities of exceeding values. 1.5C is included within the "greater than 1.0C" probability. It's a subtle point so understand the confusion. Here is the table and reference: https://www.cpc.ncep.noaa.gov/products/analysis_monitoring/enso_advisory/strengths/index.php
Thanks, I missed that "at…
Thanks, I missed that "at least".
"Wet" or "Dry" El Nino in California?
What determines the difference between a "wet" and a "dry" El Nino for the West coast of the US, and at what point does that become "forecastable"?
Depends on what timescale…
Depends on what timescale you're forecasting. If you're interested in seasonal (3-month) averages then CPC outlooks already leans toward wetter for the upcoming winter/spring (so is already 'forecastable' thanks to predictors like ENSO and trends). For other climate averages (1 week, 2 weeks), it may be predictable as much as a month in advance (see this interesting paper). With day-to-day weather, you may be able to predict it as far as 7-10 days out. We talk a bit about these timescales and different drivers in this past blog article.
PDO and El Nino
Comment : Great article on the update on ENSO.
Question : To have a true El Nino, doesn't the Pacific Decadal Oscillation have to be in the positive and the Oscillation in Atlantic ocean in the negative ? Looks like the record warm SST of the Atlantic will cause the current weak El Nino to fizzle ?
I remember in November 1976, NOAA came out with their Fall and Winter forecast and it read like this : " A Colder and Drier Fall and Winter " for the Eastern half of the continental US. They were 100 % correct. It was a very Cold and Snowy Fall and Winter here in the Ohio Valley. Did they base this on the Pacific Decadal Oscillation that turned positive in August 1976 along with a weak El Nino ?
Based on previous research,…
Based on previous research, the warmth in the Atlantic does not help El Nino to grow... it may even oppose it a touch. The state of the PDO is interesting, but I still think it's reflecting our previous 3yr La Nina... the ocean can take some time to adjust and if/when we finally get more El Nino like wintertime circulations over the North Pacific, I would expect that signal to dissipate. We shall see! Thanks for the comment.
El Nino vs. Atlantic "Nino"
If we do see the continuing trend of what could be a strong El Nino, will the associated shear an El Nino typically produces over the Atlantic basin be enough to reduce the number of Atlantic tropical cyclones, especially during the peak of the Cape Verde season and then into the Caribbean later in the fall? The Atlantic "Nino" is still unusually warm, but has this anomaly peaked and might the eastern tropical Atlantic begin to return to a more normal temperature profile? This will be fascinating to watch unfold as we head into the heart of the hurricane season. Something's gotta give, right?
CPC's seasonal outlook is…
CPC's seasonal outlook is currently posted here and will be updated again on August 10th. I know the forecasters are keeping a close eye on the trajectory of this El Nino and also the exceptionally warm Atlantic SSTs. It's a tricky one!
What Does It Mean for SE Louisiana?
Does a strong El Nino during winter mean a snowier than average winter for us?
I live just outside of Baton Rouge and, in December of 2008 and a few years later, we had about 5-6" of snowfall at our house, while Baton Rouge had barely 1" (amazing the accumulation difference within just 20 miles). It was beautiful for sure, but stayed on the ground for a few days (had gotten old by then). Roads were even impassable for a day or so because we don't have snowplows nor road salt.
It's tough to get snowfall…
It's tough to get snowfall that far south, but if there is ever a time, perhaps El Nino is it. Here is the historical average El Nino snowfall pattern for Dec-Feb: https://www.cpc.ncep.noaa.gov/products/precip/CWlink/ENSO/composites/elnino.djf.snow.gif
Thanks for the clear update
Many thanks for the great product. I had friends asking about the current El Nino and the forecast. I had given a rough answer (with some shoulder shrugging) and then had a look here and discovered I would have been quite mistaken. The high SSTs are changing the picture in a way I hadn't reckoned. Sooo ... I sent all my friends here. :) Much better answer. Thanks again and keep up the great work. (Love your analogies ... bread dough, dancing, etc.)
Thank you! You can also get…
Thank you! You can also get regular updates from our official ENSO discussion here:
https://www.cpc.ncep.noaa.gov/products/analysis_monitoring/enso_advisory/ensodisc.shtml
Send an email to ncep.list.enso-update@noaa.gov if you would like once a month notifications when the ENSO fcst is updated.
Kudos for this update
We are certainly concerned here in Central America area as we have lived this ENSO consequences in 1997-1998 with devastating effects. Therefore, any predicting advisory is definitely very helpful! We are looking forward to hearing more from you!
For updated model forecasts…
For updated model forecasts for the globe you might be interested in the NMME output that the IRI puts together each month: https://iri.columbia.edu/our-expertise/climate/forecasts/seasonal-climate-forecasts/
RONI index
Great update.
The Relative Oceanic Nino Index (RONI) is not as impressed by this El Nino as the ONI according to ERSST data. Could this explain the lack of atmospheric response? Similar to 2015 where the SST anomalies indicated a "Super" El Nino but the teleconnections simply didn't correspond as expected...Also, after experiencing more than a decade of cooling in the Pacific, is 0.5°C still a sufficient standard?
Am impressed you know about…
Am impressed you know about the RONI! It's on the CPC webpage, but a touch hard to find. But you're right that it's lagging the ONI pretty strongly and it very well could be why the tropical atmospheric response has been lagging so far this summer. Eventually I do think this event will strengthen to a point where it's clear in both ONI and RONI, but that may be a few months off. Currently, several of us at NOAA are collaborating with folks at the BOM in Australia on a project to further explore RONI in operations... so maybe we'll see it more in the future.
I'm still learning
Absolutely! The concept RONI is captivating. My graduate degree was in data Analytics but I've been feverishly trying to learn about climatology. I've been a big fan of some of the research papers people such as yourself have written. I firmly believe the whole point of identifying the strength of an ENSO event is to infer the potential teleconnections in other parts of the world. That research into RONI will certainly help. We have so much to learn about ENSO. Research analytics have taught me that nothing exists in a vacuum, correlation doesn't mean causation and nothing is set in stone. Thank you for your reply!
Awesome! Yes, I'm hoping…
Awesome! Yes, I'm hoping folks (beyond us) take a closer look at the RONI... there is a lot to understand and explore. Good luck w/ your work!
There was a paper written.on…
There was a paper written.on the 2015 el nino event. They blame it primarily on the 2015 event being a CP event versus an EP event. I know the writers here don't necessarily agree with these findings
https://agupubs.onlinelibrary.wiley.com/doi/full/10.1002/2016GL071515#:….
Not sure exactly what is…
Not sure exactly what is being referenced here. I would definitely agree that, at the peak, 1997-98 had stronger SST anomalies to the east of 2015-16 peak anomalies. We documented this in in our BAMS paper.
El Nino
Thank you Michelle for the link. I haven't had time to go through it yet. Do you think the FY15/16 event being more of a CP event contributed to the rainfall departures in California. 97/98 was a very wet year in California. From the Pacific Northwest down to Southern California the rainfall outcome looked more like a La Nina winter than an El Nino winter.
Good question! It certainly…
Good question! It certainly could have played a role along with natural variability. It's one major reason there is no 100% chance in seasonal outlooks even with a strong El Nino.
El Nino
Thanks Tom!
Does the El Nino look like in 2015/16?
Reading the article published in july/2015 “2015: Halfway over and hot“ I found a world’s Maps very similar to the current one.
Here in my region in Brazil (Janaúba - North of Minas Gerais) we had one of the most droughts in the sprint of 2015. it only started to rain in january.
Can we expect the same weather pattern this year?
God help us🙏
Congratulations on the work you! 50 years ago my grandfather planted blindly but now I can and must rely on technology!
Unfortunately for the…
Unfortunately for the upcoming period, due to El Nino, you may be on the drier side of the coin... see the maps posted here by the IRI:
https://iri.columbia.edu/our-expertise/climate/forecasts/seasonal-climate-forecasts/
It's not until Nov-Feb that this region may see some relief...
Thank you!
I look forward to seeing your updates every month and am so appreciative of the work you do! Thank you!
Thank you! Great to hear.
Thank you! Great to hear.
El Niño will be weak
U can’t predict super El Niño . In far advance. Because the southern states should not get snow I am in Wisconsin we been in snow drought for years because of that El Niño. La Niña is better for snow. I hope El Niño dies and then go to La Niña/ I think El Niño interfere La Niña because La Niña supposed to be cold in Midwest. El Niño been a problem. I hope El Niño is weak. So California has a drought and Wisconsin cold and snowy winter. I don’t understand why La Niña is bad news no it is not. Without La Niña Wisconsin doesn’t have snow and cold .
El Nino
The effects of any one El Nino event do not last for years. El Ninos are classified by their SST departures above normal not their outcomes. And SST models are very good at predicting what those will be during this time span. SST models were very good last year at forecasting the La Nina SSTs well in advance. Odds favor at least a moderate El Nino.
Spatial data on past El Nino events
Were can I get spatial data on which areas were impacted by past El Nino events? To be specific, I am looking to get data on which sub-regions/ states within countries faced deficit in rainfall due to El Nino?
You can use this website to…
You can use this website to see where El Nino and La Nina have led to above or below average temperatures or precipitation.
https://www.cpc.ncep.noaa.gov/products/precip/CWlink/ENSO/regressions/
Nino 3.4 temps
Looks like the Nino 3.4 region is heating up again. About to cross into moderate strength territory. The Nino 1.2 is still very hot with SSTs over 3.0 C. Hoping this El Nino is a strong east based event.
Hot Year
Wonder if 2023 will be the hottest year on the record at this rate...
East Africa
Hello, how does El Nino forecast for East Africa? There were reports of more rain and we have not seen much above average this winter.
El Nino is usually…
El Nino is usually associated with an increase in rains over East Africa, which if they materialize would be good news for an area in drought for so long.
East Africa monsoon
I lived in Tanzania for a couple of years back in the late 2000s (southern highlands area), and I remember that the rains there generally began in late November. I also remember that Dar es Salaam (the country's largest city) would get downpours from the long rains in February and March.
So, if this El Nino were to affect the monsoon there, I suspect it would not be noticeable until then.
High pressure ridges in NW US
is there a causal relation between El Niño and high-pressure ridges forming in the northwest United States in the winter?
Usually during El Nino, we…
Usually during El Nino, we see a pattern where a stronger than average jet stream is pointed towards the southern West Coast bring storms that direction. And you tend to see lower pressure in the North Pacific.
You can see the set up in this schematic.
https://www.climate.gov/news-features/featured-images/how-el-ni%C3%B1o-…
El Niño in intermountain West
Thank you.
In some years the intermountain West seems to experience persistent high pressure ridges, resulting in temperature inversions and drier conditions. Is that what we can expect from an El Niño?
El Nino is often associated…
El Nino is often associated with a positive Pacific-North America pattern (PNA), which includes a stronger-than-average high over the northwest US/western Canada. This pattern has a lot of intraseasonal variations, meaning it's not always positive during El Nino, but it tends to be so.
El Nino Highs
Tom,
A North Pacific high is associated with a La Nina winter. We've witnessed that the past three years on the west coast.
Central tropical Pacific Ocean
May I ask how many instruments does NOAA have in the central tropical Pacific Ocean and where they are located? I hope you provide assistance to these small islands states in their weather forecasting through staff training and education, equipment provision etc. Thank you.
NOAA and other US and…
NOAA and other US and international agencies have lots of instruments in the tropical Pacific! Tom wrote about one of the most important arrays here: https://www.climate.gov/news-features/blogs/enso/dearest-tao-love-lette…
Comments have been disabled on this article