Forecasting, Fast and Slow
Tell someone you forecast for a living and they often think of their favorite weather broadcaster. “Are you on TV?” is the second question asked after “Oh, great! Can you tell me what I should bring/wear tomorrow?” After an awkward pause, I tell them I don’t forecast the daily weather, instead, I forecast the climate (the awkward pause explains why I prefer blogging over TV).
So, what exactly do you do?
First, confession time: my expertise is in forecasting ENSO, but luckily, my colleagues at the NOAA Climate Prediction Center (CPC) are the world-class forecasters who provide climate outlooks. If you’re a regular reader of the ENSO blog, then you have already encountered CPC’s seasonal (3-month average) outlooks:
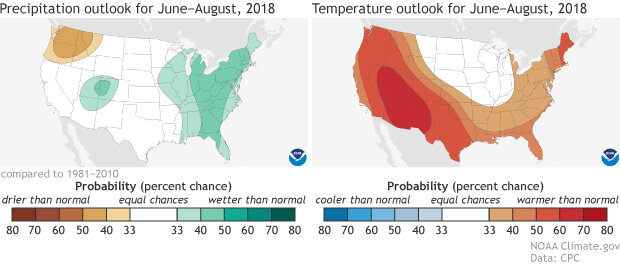
NOAA Climate Prediction Center (CPC) Seasonal Precipitation (left panel) and Temperature (right panel) Outlook for June-August 2018. Color shading indicates the probability of below or above average temperature or precipitation. Data from NOAA/CPC and modified by NOAA Climate.gov.
We often mention the seasonal outlooks on this blog because ENSO has a clearer footprint on them. But there are many different climate outlooks that are produced regularly at CPC.
For temperature and precipitation, my colleagues also make forecasts for 6-10 days, 8-14 days, 3-4 weeks, and one month into the future (and many others listed in Footnote #1).
Uh, that’s a lot of options.
At this point you might be scratching your head and wondering (a) why are there so many different climate outlooks? And (b) why don’t we just make a single forecast that spans each day out to 90 days? After all if you’re making forecasts for the upcoming season, then doesn’t that also imply you can make a forecast for every day within that season?
Let’s put the first question aside for now. The answer to that second question, my friends, is no. And if you believe we can, then, well, you probably believe lots of other … um … things.
Getting back to that seasonal outlook maps above, if forecasters are shading a region in red color, does that mean every day within that 90-day period is going to have above-average temperatures? All together now… “No!”
What it means is that, over a 3-month period, we expect the temperature to be above average. This means that within the season there can be days, weeks, and even a month or so when temperatures are near or even below average—even bone chilling cold (polar vortex, anyone?). But when averaged over the entire three months, we believe, with some probability, above average temperatures are favored.
Probability? That sounds wishy-washy.
As we intuitively know, a forecast provided for tomorrow is more certain than a forecast for a day next month. Weather forecasters can say the temperature tomorrow will be, say, 74°F, and they’ll be in the ballpark. To put it mildly, it is not especially realistic to make the same sort of forecast for a particular day 30 days from now.
But the situation changes when we start looking at averages, which can help to reduce the uncertainty. You can’t predict the outcome of one coin toss, but predicting the average outcome of 100 tosses is more doable. Likewise, a forecast for an 8-14 day average is going to be more reliable than a forecast for a single day within that 8-14 day span, especially later in the period. But what is it about forecasting averages that is different from giving you the forecast for tomorrow’s weather? Why are we able to say anything at all? And, getting back to the earlier question, why are there so many different forecasts?
Mainly, there are different factors driving the forecast over various spans of time. These driving factors are not equally important and they are not always predictable.
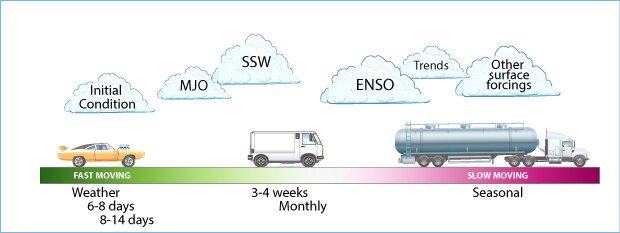
Forecasting weather and climate means predicting both faster and slower moving features of our Earth System (atmosphere, ocean, land). For weather, 6-10 day, and 8-14 days it means getting the current conditions (or initial conditions) of the atmosphere, ocean, land as close to reality as possible. For Week 3-4 and Monthly outlooks, in addition the faster moving features, making useful forecasts also means correctly reproducing some blend of the Madden Julian Oscillation (MJO), Sudden Stratospheric Warmings (SSW), El Niño-Southern Oscillation (ENSO), and trends. For Seasonal outlooks, it means accurately predicting ENSO, trends (natural decadal variations and human caused), and other surface boundary forcings (sea surface temperature, sea ice, snow cover, soil moisture, etc). Illustration by Carlyn Iverson with NOAA Climate.gov.
Moving fast
To make a forecast for days in the coming week or so, it is critically important to know where you are starting. When you are strapped into a fast racecar, you have very little room for error and exactly where you start, and the almost undetectable choices a driver makes during the race, could be the difference between winning and losing. Same goes for the movement of our atmosphere—you better know, for example, exactly where the cold front is setting up and where you are relative to it if you are going to make a successful forecast.
Your forecast will be better if you know where the cold front is located one day prior to it reaching you than when it’s three days away. This is why it is often helpful to have weather forecasts updated frequently (even several times in a day). The current conditions, or initial condition, as modelers and forecasters like to say, are critical and there is a lot of important effort that goes into getting this right (2). The rest of the race is powered by large supercomputers as engines using physical equations that come awfully close to reproducing the movement of our atmosphere.
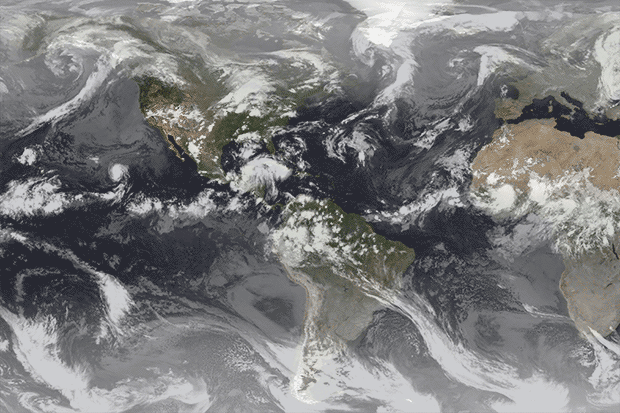
The atmosphere moving chaotically. Daily data from GOES-R satellite, obtained from NOAA View.
When you start to forecast for averages, the driving factors begin to change and it is not as important to precisely know where the cold front is located. Also when we start to talk about averages, climate forecasters also begin to express their outlooks in terms of probabilities. Rather than say the average temperature for next week will be, say, 76°F, CPC forecasters say there will be an 80% chance of below-average temperatures (3).
In a 6-10 day or 8-14 day outlook, the initial condition is still fairly important, but as you can imagine, in the average, individual warm and cold days may cancel out (4). Now it becomes more important to predict the more persistent, slower features in the atmosphere instead of the faster moving weather systems—for example, a big, slow moving dome of high pressure, bringing with it, an extended heat wave.
The twilight zone
Then we approach a timescale that is a mixture of both fast and slow. These are the Week 3-4 outlooks, which are an average of 3-4 weeks into the future, and also the monthly outlooks. Now the slower moving features have increasing importance over the chaotic atmosphere. Some major drivers are the Madden-Julian Oscillation, El Niño-Southern Oscillation, Trends (natural and human caused), and particularly over Europe/Asia, the potential influence of Sudden Stratospheric Warmings. These drivers do not change a lot day-to-day and so forecasts don’t need to be updated every day (Week 3-4 are updated once weekly and Monthly outlooks are updated twice per month).
Moving slow
Finally, as far as CPC is concerned, we get to seasonal climate outlooks, which are driven by even slower movements of our Earth system. The fast, chaotic movements of the atmosphere are still there, but you simply can’t predict them (5). Now, understanding and predicting the slower varying motions of our ocean and land surfaces become critical. The major drivers become the El Niño-Southern Oscillation, decadal climate trends (natural and human caused), and other surface boundary forcings (e.g. sea surface temperature, soil moisture, sea ice, snow cover).
Bottom line: not all forecast drivers are created equal--drivers of fast cars (e.g. daily forecasts out to 7 days) need to pay attention to each detail and drivers of slow cars (e.g. seasonal outlooks) need to get the general direction right. And because there will always be uncertainty, climate outlooks are expressed as probabilities. It may be that a particular user may not find a monthly average outlook useful, but they can take some action for a daily or weekly average. If climate forecasts are what really floats your boat then that’s wonderful, but seeing all the options is a bit like being at a large buffet. I like my grandma’s recommendation: pick what you can eat.
In addition to our editor and blogging team, I'm thankful for Melissa Ou (CPC), Mike Tippett (Columbia University), Mike Halpert (CPC), and Arun Kumar (CPC) for their edits and suggestions.
Footnotes
(1) My colleagues at NOAA CPC have monitoring and forecast products for all sorts of phenomena and forecast time horizons. Just as a sample: US Hazards for Days 3-7 and 8-14, Week 1 and Week 2 Global Tropics Benefits/Hazards, Monthly and Seasonal Drought, Teleconnections, Seasonal Hurricane Outlook, Stratosphere, Oceans, Monsoons, etc.
(2) In order to make a good forecast, there needs to be the best possible estimate of the current state of the atmosphere and the surface (ocean, land). However, we do not have measurements or observations from every point on the Earth, so there are missing gaps in the current state. To infill these observational gaps, we use the same computer model (ideally) that we use to make our forecasts. So, data assimilation combines all the observational data we can get our hands on (satellites, buoys, weather stations, ships, etc.) with the model filling in the rest. Specifically, a previous forecast run is compared with newly gathered observations, and the model is updated to reflect these observations. Doing all of this is an incredibly intensive and expensive process-- requiring large supercomputers to crunch through all the data. The better your data assimilation, the better your initial conditions (and the better your forecast). If you are curious to learn more, check out this handy explainer from ECMWF.
(3) Precipitation forecasts are a different story than temperature. The errors and uncertainty, even a daily weather forecast, grows so fast for precipitation that a certain percent chance of showers is provided.
(4) Astute readers may question why there is a 6-10 day climate outlook when they could make a decision on an National Weather Service forecast for day 6 (note: daily forecasts are currently issued out to 7 days). Anecdotally, we have heard examples of businesses making building or landscaping choices based on the 6-10 day average--- for them they just want to know whether the period will be drier/wetter/hotter/colder than average in order to make a decision on whether to mobilize resources.
(5) CPC gets regular email asking whether it will rain on the day of a wedding two months from now. We really don’t know. We’re not withholding it from you. On the other hand, knowing when temperature will warm up on average might be really helpful if you’re stocking shelves.
Comments
Forecasting Fast and Slow
Forecasting Fast
Comments have been disabled on this article