What is the jet stream?
This is a guest blog by Tim Woollings , a professor of climate science in the Department of Physics at the University of Oxford in the UK. Tim recently won the Louis J. Battan Award from the American Meteorological Society for his book “ Jet Stream : A Journey Through our Changing Climate.”
The term jet stream is used increasingly in both weather forecasts and news reports of extreme events, from cold spells and flooding to heatwaves and droughts. But what is the jet stream, and why do we care about it so much?
The jet stream is a fast, narrow current of air flowing from west to east that encircles the globe (not to be confused with the Gulf Stream which is instead an ocean current of drifting seawater). It was first documented by Wasaburo Oishi, whose regular weather balloon launches from Japan in the 1920s invariably ended up flying out over the Pacific Ocean at a considerable rate (footnote #1).
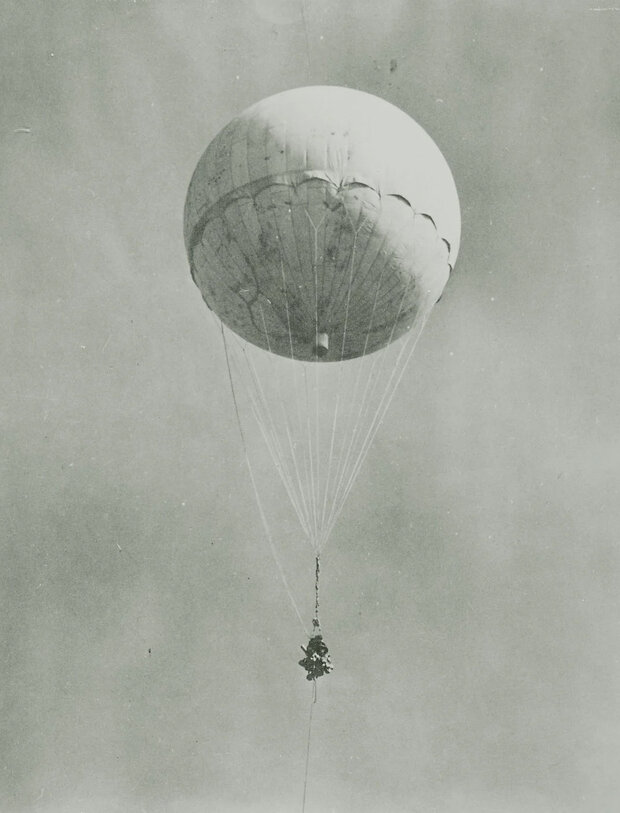
A hydrogen balloon. Similar to weather balloons, except this one is a Fu-Go fire balloon loaded with bombs (see text at the bottom of the blog post). These balloons were launched into the jet stream from Japan and traveled over the North Pacific Ocean. U.S. Army photo via Wikimedia.
As revealed in Oishi’s measurements, the jet is strongest in the upper troposphere, around 6-8 miles up. This is roughly the level at which airplanes fly, and indeed they often pay careful attention to the jet stream: fuel is saved by staying in the jet if you’re heading east, and by avoiding it if you’re going west. While we describe the jet as narrow, this is somewhat subjective—it’s typically a couple hundred miles across, which gives a wide enough corridor for flight planning.
If the jet stream is so high up, why do we care about it?
It turns out that the jet, on a number of counts, directly impacts surface weather patterns.
Firstly , the jet acts to steer mid-latitude weather systems, so it can control which regions are storm-bound and, in the extreme, which can become dangerously dry.
Secondly , while the fastest winds of the jet core are far above the surface, weaker winds often extend all the way down to the surface. Many of us who live in the midlatitudes are acclimatized to prevailing westerly winds (i.e. winds that blow from west to east), and these winds are the very underbelly of the jet stream dragging along Earth’s surface.
Thirdly , the jet stream also acts as a sharp boundary between contrasting air masses, with relatively warm, tropical air to the south and much colder air on the northern, poleward side. The location of the jet, and hence also the boundary, has a strong influence on temperatures down at ground level.
Why do jet streams exist?
Because of two crucial ingredients: rotation and heating.
The planet is unevenly heated due to the disproportionate concentration of solar heating in the tropics and lack of heating in the poles. This forces the atmosphere into motion, as some bits of air become warmer and more buoyant than others. But the planet also rotates, and this imposes constraints on the resulting fluid flow, particularly in the north-south direction (footnote #2). These two ingredients mean that the resulting flow stretches out in the west-east direction and jet streams are formed.
Striking lab experiments to show that these two ingredients result in jet streams were first performed by Dave Fultz , who had witnessed the power of the jet stream first-hand as a meteorologist at the US air base on Guam during World War II. Returning to Chicago after the war, he set out to reproduce such a flow by building a spherical water tank with a heating element underneath. Then, to simulate the Earth’s rotation, he spun the tank and saw the flow break down into chaotic waves and, perhaps more excitingly, several west-to-east jet streams.
Not just one jet stream
So far we have somewhat loosely referred to the jet stream, while in fact there are several in both Northern and Southern hemispheres. One type, termed a subtropical jet, is predominantly a high-altitude feature invariably found at the edge of the tropical Hadley Cells . In contrast, eddy-driven jets (footnote #3) are deeper, and it is these specifically, which reach all the way down to the surface. They are often called sub-polar jets, even though they can be found over a wide range of latitudes. The two jets are sometimes separated in latitude (often this is the case over the Atlantic Ocean), but sometimes merged together (as is more common over the Pacific Ocean) forming a broader region of midlatitude west-to-east winds.
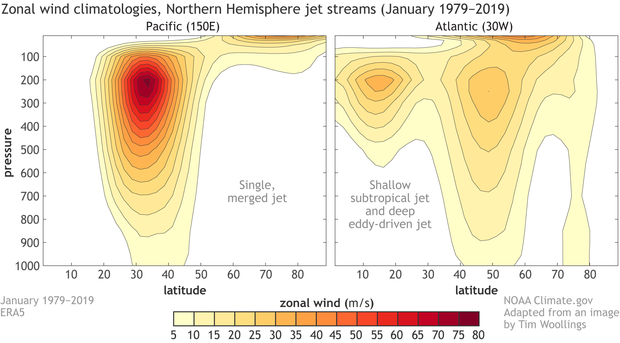
The jet streams or average zonal wind (in meters per second) over a cross-section of the Pacific Ocean (left panel) and Atlantic Ocean (right panel). The x-axis shows the latitude in the Northern Hemisphere with the equator on the left and North Pole on the right. The y-axis is the pressure level oriented with the surface on the bottom and the top indicating the top of the atmosphere. Data is based on ERA5 using a 1979-2019 climatology. Image courtesy of Tim Woollings and modified by Climate.gov.
In much the same way that the ocean surface is never completely flat everywhere, the jet streams are generally always in motion, sometimes shifting north or south across huge regions, sometimes meandering like a lazy river. Hence their importance for forecasting; the jets can change from one week or month to the next and regional patterns of heat and cold, wet and dry will shift along with them (footnote #4).
For much of the midlatitudes, the local jet stream is typically the single most important factor in regional weather variations on these timescales, so that if you only had one piece of information about the atmosphere, you would want to know about the jet. Commonly used circulation indices such as the North Atlantic Oscillation (NAO) or Arctic Oscillation (AO) are dominated by jet variations as a result. A positive NAO index, for example, is a sign that the eddy-driven jet over the Atlantic is stronger than usual and shifted to the north.
Given this is the ENSO Blog…
Climate forecasters are largely concerned with trying to predict how the jets may behave over the coming months or seasons. While still very challenging, this task is made possible because the jets don’t just vary chaotically as the butterflies flap (although they certainly do lots of that). Particularly on seasonal timescales the jets can be nudged, or influenced, by other factors in the climate system, and ENSO is the prime example of this.
An El Niño event can affect the jets in a couple of ways: firstly, by warming the tropics and amplifying that crucial temperature contrast between latitudes, and secondly by triggering regional patterns associated with Rossby waves . The atmospheric circulation over the North Pacific this winter provides a good example of this latter effect.
In an average year, the jet extends across the Pacific towards North America, although it’s strongest over Japan. The jet first became widely known when American forces were caught off-guard during World War II, with their high-altitude bombers often stranded over Japan by raging headwinds. Meanwhile, the Japanese Fu-Go campaign used the jet to carry balloon-bombs downwind across the Pacific to America, albeit with little success because most of the bombs dropped too early, landing in the ocean.
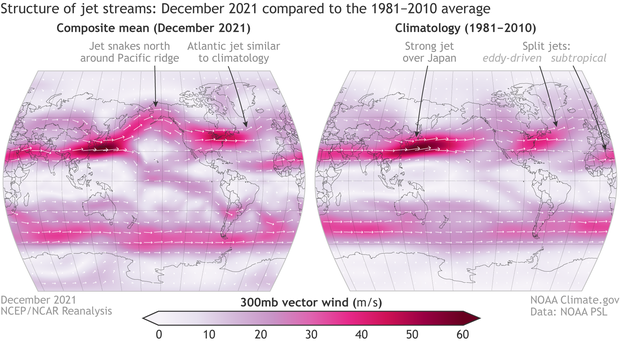
Structure of the Northern Hemisphere jet streams in December 2021 compared to the climatology (average from 1981-2010). Display is showing the wind vectors and strength at the 300mb level in the atmosphere. Figure by NOAA Climate.gov using NOAA ESRL/PSD data.
But December 2021 was no average year; instead the classic La Niña signal, often referred to as the negative phase of the Pacific-North America pattern , was evident. Instead of the jet stream flowing due east from Japan and over the North Pacific Ocean, it snaked northward to Alaska before returning southward over the contiguous United States. This is indicative of a wave of influence originating in the tropical Pacific and curving across the North Pacific Ocean to North America.
So the art of subseasonal-to-seasonal forecasting for the midlatitudes is largely concerned with predicting the state of the jet streams. Cases such as this with a regional Pacific response to ENSO are often well predicted, and December 2021 was no exception. Other features such as the Atlantic jet are harder to predict, yet modern models often have useful skill here too (footnote #5). And hardest of all to predict is the longer-term trend: as the climate warms further, how will the all-important jet streams be affected? Clever ideas on this abound in the literature, but overall our confidence in what will happen unfortunately remains low.
Lead Editor: Michelle L’Heureux (NOAA CPC)
Footnotes:
(1) In an attempt to reach the widest possible audience, Oishi published his results in Esperanto—an experimental “international” language invented in the late 1800s—and as a result the jet stream remained little known outside of Japan.
(2) These constraints are essentially due to conservation of angular momentum, as an air parcel moving north or south is changing its distance from Earth’s axis.
(3) ‘Eddy’ is used to describe a swirl in the atmosphere, just like a swirl of water in a river. Weather systems such as cyclones and anticyclones are examples of atmospheric eddies, so a hidden complexity here is that these weather systems actually help to ‘drive’ the eddy-driven jets.
(4) This reveals a complex two-way coupling between the jets and the temperatures. While the jets are formed in response to the same heating which gives us warm tropical and cold polar regions, the dynamics of the jet cause it to move around and the sharp boundary between the air masses is constrained to follow suit.
(5) It has been shown the jet over the Atlantic can be partially predicted for the coming season (i.e. a forecast made in November for December-January), and even beyond. However, it has less accuracy than ENSO, which can be used many months in advance (e.g. when predicting the Pacific jet).
Comments
A note to readers: Comments are moderated
Just a reminder that comments are moderated prior to publication so there might be a delay before your comment appears. Although we know our ENSO blog readers would never engage in such bad behavior, I'll go ahead and remind everyone that all the standard terms & conditions of internet participation apply: no profanity, name-calling, personal attacks, or violence.
Jet Stream
Thanks for posting this Tim. And congratulations for the AMS award at the annual meeting for your book: Jet Stream. This is a book that should be in the library of every meteorologist. Tim has written a 'flowing' story (pun intended) about the major driver of Earth's weather.
Thanks Joe, that's very kind…
Thanks Joe, that's very kind.
Best wishes!
Tim
Meridional Jetstreams
Hi and thank you Tim for the great article . The meridional jetstream is more prevalent during the last few years , it has been wavy and even very wavy at some occasions , during the prevalence of meridional jetstreams weather and climatic predictions get less accurate as such less reliable and foggy . how do you correct for the margin of error in seasonal predictions with the presence of such wavy jetstream , do your weather prediction models have something built in that can account for its effect ?
Many thanks
BR
Mohammad Alkhateeb
Jordan.
Thanks for the great…
Thanks for the great question Mohammad. There's actually a lot of uncertainty around jet waviness - eg here's a recent study suggesting it's not increasing as much as was thought: https://doi.org/10.1126/sciadv.aay2880.
In terms of seasonal predictions, these can capture wavy jets if there is a predictable seasonal forcing, such as the La Niña this year.
Often the waves are sub-seasonal features though, and are less well captured by the seasonal forecasts. There can be skill in these at shorter lead times, say over a few weeks, especially if there is some other predictable forcing such as the Madden-Julian Oscillation.
Hi, great discussion. Would…
Hi, great discussion.
Would you say jet streams will eventually reach a point where they are more than sub-seasonal features, and will they exhibit unpredictable properties as period cascading might suggest?
Thank you :)
permanent versus sub-seasonal
Hi Amanda,
Thanks for your question. I cannot speak for Tim, but I can offer my perspective. I would say that the jet stream is already at a point where it is more than a sub-seasonal feature - it is a permanent feature with all sorts of important subseasonal, seasonal, and decadal components. The two main ingredients for jet streams - rotation and uneven heating - are always present, and so we can always count on jet streams being around. However, there are all sorts of factors on these other timescales that modify the strength and position of the jet streams, and those factors are critical for our weather and climate predictions.
So, these components of the jet stream not specifically tied to the seasonal cycle of solar insolation already exhibit chaotic variability that plagues our weather and climate forecasts. Whether jet stream variability becomes more or less predictable is an interesting question.
Good Post
Very nice post , It helps me to know lot of things, the writing skill is really good।
Thank you।
jet streams changing from 79 to present...
Dear fellow scientist or have space weather curiosity as I. Asking? What instrument, or observation satellite up there in the late 70s to early 80s. I watch the Shuttle make it's very, first landing live, front Vegas. In shop class in 81. I also remember very clearly that when it launched three day before, which I also witnessed live via cable news. Lol. With no instruction to any of this space conviction I have with all matter, I pretty much understand it is I direct result of angleuar momentum. So are weather, are Bodies. Well cell have spinning things, in them that protect the nucleus. That's pretty much how gravity also works,. So with the atmosphere, and the awesome Physics that get us to this point. The jet streams seemed to, change and weaken. And also I point out we humans started launching rockets into space almost monthly in the mid 80s. All leaving this atmosphere at roughly 17,000mph through that wind, AL the while also pulling out our atmosphere into space. And from knowing aerodynamics. The two wind change dynamics,. I realize that the Oribital Space Launch Systems, organization, has successfully launch 288 launches. All leaving our atmosphere at just under 17,000 mph. O and a flame has as, maybe not hot as our star, you get the pitcher. If the brain like to run its extermination of Physics, for action, there has to help action in order to get reactions. Even in the cells in our bodies and all other earthly and space bound, microscopic particals the all far as I known since learning, about molecules at the age of 8. I Just staird at my desk also seeing those tiny as things that made up that drsk top. And they need to spin to help create magnetics and forse by way of momentum. We have a solid object to learn from.
Hay it seems very possible that humans space launching has had way more impact than car emissions. LoL They run cleaner now way cleaner than in the 80s.
What happens to a piece of debris? when going over it with your transport. You look in the mirror, and it followed the vehicle a few meters if not more, seldom ever not move from the action of that action of speed and forward momentum. LoL. It is very simple.
Just like The Us Of American will be 250years old in 2026, I remember celebrating the bicentennial celebration in 1976. It seem. The simple got left behind and the end is coming fast. I not really being left behind. LoL no 2029. Konitic happiness could really make humans even more mean towards each other. Well good luck. I can farm and hunt. If need be. Very simple
Enjoy the week and the reentry of the astronauts with the to Russian Humans fellow earthlings. You know. V
You might enjoy this brief…
You might enjoy this brief history of weather satellites looking back 60 years to the worlds first weather satellite TIROS-1
https://www.nesdis.noaa.gov/news/celebrating-60-years-of-the-worlds-fir…
JET STREAM WEATHER VRS. RANDOM WEATHER
AS A YOUNG MAN, I WOULD WATCH THE WEATHER ON TY WHICH USUALLY CONTAINED THR JET STREAM LOCATIONS PULLING UP HEAT FROM THE EQUATOR OR PULLING DOWN THE COLD FROM THE NORTH POLE. IT ALL MADE SENSE. NOW, I ONLY SEE TEMPERATURES W/'O A REASON WITH AN OCCASIONAL CLIMATE CHANGE FINGER POINTING. TOO BAD. SO SAD. IT USED TO MAKE SENSE.
Jet stream vrs. Random Weather
I'm not sure where you get your weather info nowadays, but there is still plenty of TV and other media coverage that includes discussion of the natural influences, including the jet stream, on daily weather. But even if you can't find such explanations on TV, you can always find them from NOAA. The very first thing that appears on the weather.gov page is a daily discussion of the regional ("synoptic") features of the atmosphere that will influence the weather across the U.S. Just click the "read more" link.
You won't find a lot of that type of thing here on Climate.gov because we are focused on the things that influence climate, not weather.
Question about the jet stream
This was a very interesting and informative post.
Now for my question: Can its (their?) present and predicted positions be found somewhere at the NWS site? What about NOAA's?
jet stream
I want to follow where the jet stream is on a daily basis but nobody I can find has a map showing where it is anymore. Can I get it on this site? Thanks
You can look at this site…
You can look at this site for daily displays of upper-level winds: https://earth.nullschool.net/#current/wind/isobaric/250hPa/orthographic
Comments have been disabled on this article