July 2023 El Niño update: learning the steps
The chance that our young El Niño will continue through the winter is greater than 90%. Why are forecasters so confident? What are the chances of a strong El Niño? And what effect does El Niño have on global climate patterns? We have a lot to talk about today, so let’s get to it!
Tumbling class
The Niño-3.4 Index, which measures the temperature of the surface of the central tropical Pacific Ocean, is our primary metric for El Niño. It was 0.8 °C (1.4 ˚ F) above the long-term average (long term = 1991–2020) in June, according to our most consistent dataset, ERSSTv5. This is comfortably above the El Niño threshold of 0.5 °C.
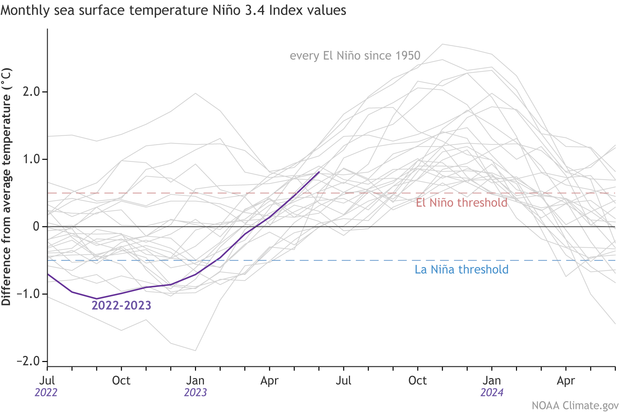
The three-month-average Niño-3.4 Index, the Oceanic Niño Index (ONI), was 0.5 °C for April–June 2023. In order to qualify as an El Niño year and be colored red in our historical record, the ONI must be at or above the threshold for at least 5 three-month periods. In this case, El Niño conditions would need to last through at least the August–October average to qualify. We have a confident forecast for this… but I’m getting ahead of myself. Back to the present!
Middle school dance
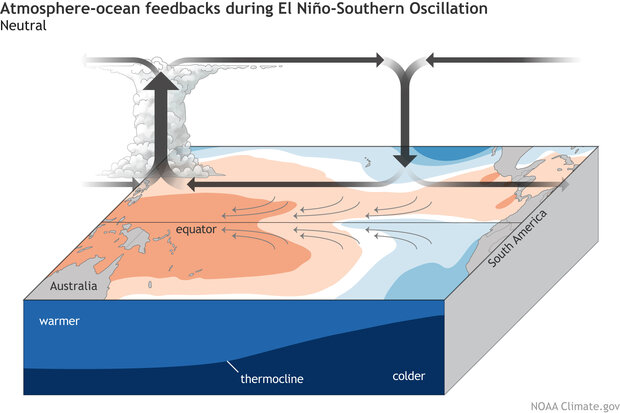
El Niño is a coupled climate pattern, meaning the changes in the ocean temperature are paired with changes in the atmosphere. These changes show up in the Walker circulation, the large-scale atmospheric circulation pattern over the tropical Pacific. The average Walker circulation is driven by the very warm waters in the far western Pacific and consists of rising air and storms over the far western Pacific and Indonesia, west-to-east winds aloft, descending air and dry conditions over the eastern Pacific, and the trade winds, east-to-west surface winds.
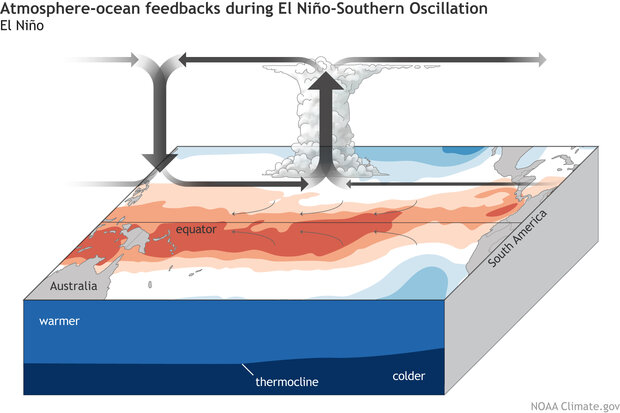
El Niño shifts this circulation by increasing the amount of rising air, clouds, and rain over those warmer-than-average waters in the central Pacific. The trade winds and the upper-level winds slow, and the overall circulation weakens. The weaker trade winds allow the surface to continue to warm, and a feedback mechanism is born. For more details on this feedback, check out Michelle’s excellent (and tasty) post.
Evidence for the atmospheric part of El Niño includes changes in tropical Pacific winds and cloud patterns. At this early stage of El Niño, the atmospheric response is present, but still quite weak, especially relative to the oceanic anomalies. We did observe more rain and clouds over the central Pacific and some drier conditions over Indonesia, which is typical for El Niño. Also, the Equatorial Southern Oscillation Index, a measure of the Walker circulation strength, was in the bottom quarter of all June values, so respectably negative (negative indicates weaker). However, stronger El Niño events are usually preceded by bursts of much weaker trade winds, but we haven’t seen much of those so far.
Winds and atmospheric conditions always fluctuate more from month to month than ocean surface temperatures, so this weak response isn’t a reason to doubt the forecast… yet. It’s still very likely that El Niño will continue at least through the end of the year, but this El Niño is taking place in the context of a very warm global ocean, and we don’t know how the warm globe will affect El Niño’s atmospheric conditions.
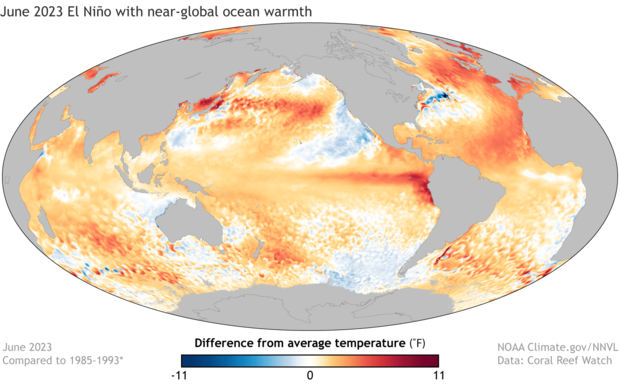
June 2023 sea surface temperature difference from the 1985-1993 average (details from Coral Reef Watch). Much of the global oceans are warmer than average. NOAA Climate.gov image from Data Snapshots.
One potential outcome is a weaker atmospheric response than we might otherwise expect. The strength of the atmospheric response is related to the pattern of sea surface temperature throughout the tropics. When El Niño is clearly the loudest voice in the room, as it was during the 1997–98 El Niño, the atmospheric response is clear. However, when the western Pacific and the rest of the tropics are also warm, the response may be more muddled. This outcome is important not just for El Niño itself, but also because many of El Niño’s impacts on global weather and climate patterns are communicated around the world via these atmospheric changes.
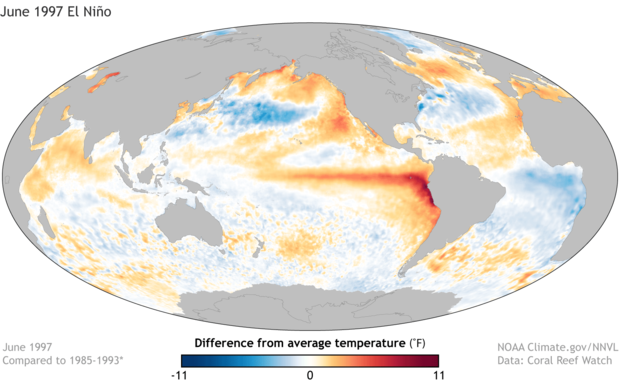
June 1997 sea surface temperature difference from the 1985-1993 average (details from Coral Reef Watch). El Niño's warmer-than-average pattern stands out clearly in the east-central Pacific. NOAA Climate.gov image from Data Snapshots.
The Nutcracker
Now it’s time to talk forecast. Our computer climate models are consistently predicting that El Niño will continue through the winter, providing a major source of confidence.
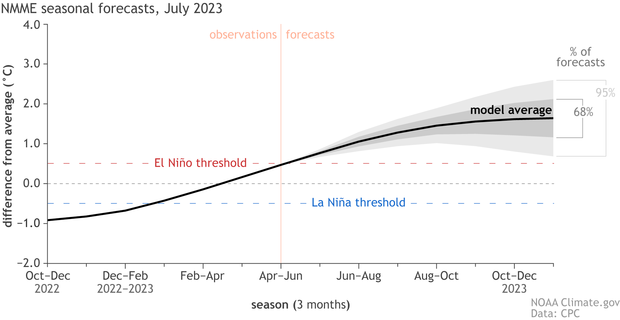
July 2023 climate model forecasts for the Niño-3.4 temperature anomaly in 2023 from the North American Multi-Model Ensemble (NMME). The black line shows the model forecast average; darker gray envelope shows the range of 68% of all model forecasts; lighter gray shows the range of 95% of all model forecasts. NOAA Climate.gov image based on a graph from Emily Becker.
Also, there is quite a lot of warmer-than-average water under the surface of the tropical Pacific. In fact, the temperature of the subsurface in June 2023 was the third-warmest June value in our record, which goes back to 1979. This warm subsurface will feed the surface for the next few months, helping to sustain El Niño conditions.
How about potential strength? El Niño’s maximum Niño-3.4 Index values, aka its peak, almost always occur in November–January. We estimate about an 80% chance that this El Niño will peak with a maximum Niño-3.4 Index of at least 1.0 °C, a 50% chance of at least 1.5 °C, and a 20% chance of above 2.0 °C. These thresholds are, respectively, how we categorize moderate, strong, and very strong El Niño events, but this is just an informal classification. Generally, the stronger the sea surface temperature anomaly, the stronger the atmospheric response, and the more consistent the pattern of El Niño’s remote impacts on rain and temperature patterns. However, as I mentioned above, the warm global ocean may complicate this relationship.
Touring production
That said, El Niño is still our best source of information for upcoming seasonal weather and climate, despite operating against a backdrop of higher global temperatures. El Niño’s impact on global precipitation and temperature patterns is strongest in the Northern Hemisphere winter, both because that’s when El Niño reaches its peak, and because the jet stream, which is influenced by El Niño, is a major player for winter weather.
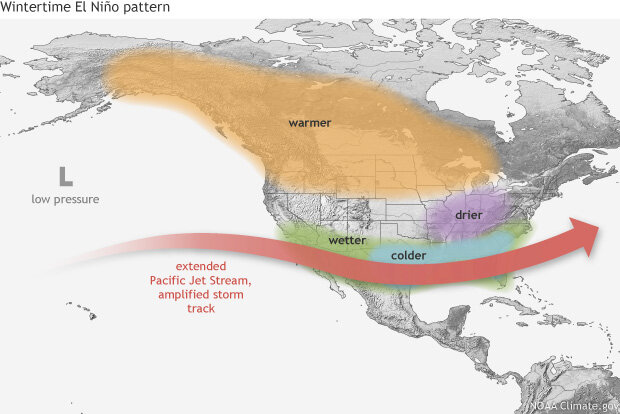
Typical impacts of El Niño on the jet stream and winter climate across the United States. NOAA Climate.gov map by Fiona Martin.
Other parts of the globe may see impacts before that. June-August dryness is common for India, the Maritime Continent, eastern Australia, and the Caribbean. Warmth is common in the Caribbean and parts of South America. And then there’s the hurricane seasons in both the eastern Pacific and Atlantic Oceans.
NOAA’s Climate Prediction Center prepares outlooks for upcoming seasons, which take El Niño and climate trends into account. Keep an eye on those maps for the patterns that forecasters think will be most likely later this season and for fall and winter.
Comments
El Nino Bar Height
"primary metric for El Niño. It was 0.8 °C (1.4 ˚ F) above the long-term average (long term = 1991–2020) in June"
Hi,
Thanks for putting these blogs together. Education is such a powerful tool.
My question is about the long term average above. So as we have increasing ocean temperatures it appears that the absolute value of this long term average is likely steadily climbing as we roll more years into the average.
How does the absolute value now compare with the absolute value that previous El Nino events had had to reach before being declared? What bar did the 1997-98 El Nino have to reach?
Sorry if this is all obvious and explained somewhere else.
Harry
Hi Harry, The threshold for…
Hi Harry,
The threshold for El Niño is always 0.5 degrees C above the long-term average, but the period over which the long-term average is calculated changes. We use the most recent 30 year period, in this case 1991-2020. Here's an article about how we try to take global warming into account: https://www.climate.gov/news-features/understanding-climate/watching-el…
Increased Global water temperatures
Great piece Emily,
Very enjoyable and well written, excellent explanation of El Niño. The graphs you shared are very concerning. I understand the complications for your El Niño models but also just dramatic example of the changes occurring.
Thank you
Chandler
West coast AR events
Did last winter’s west coast AR events have any correlation to the Hunga Tonga eruption? Will we see more AR events with this upcoming El Niño?
atmospheric rivers
I'm not aware of any studies that have investigated the connection between the Hunga Tonga (or any volcanic) eruption and atmospheric river activity, but I doubt it had any impact on last winter's West Coast activity since the eruption occurred much earlier than last winter's atmospheric rivers. That's not to say that volcanic eruptions cannot leave a longer-lasting impact on the climate, including on ENSO (see here and here), but I do not think the Hunga Tonga eruption was sufficiently explosive for such an impact.
Regarding the impact of El Nino on atmospheric rivers, this previous blog post suggests that activity tends to be elevated in the western US during El Nino winters. So, we may expect an elevated probability of more frequent than normal atmospheric river activity, but as we saw last winter, sometimes the climate system has other plans.
Australian BOM ENSO Update
Their ENSO update came out this morning. According to their analysis, while there are El NIno SSTs in the Nino 3.4, the atmosphere has yet to respond and is still in an ENSO Neutral mode. Is this unusual or is it a common occurence?
Their prior update, they stated the trade winds needed to cease
El Nino or neutral?
That's a good question. Without digging into the specifics of their reasoning, I would say it is unusual to have Nino-3.4 sea surface temperatures so warm (latest weekly index values around 1.2C) without a clear El Nino response in the atmosphere. Back in May, I speculated that this event may punch below its weight during its developing stages because the global oceans outside central-eastern tropical Pacific are so warm. Perhaps that is what is occurring now? I will also note that there have been some El Nino-like tropical atmosphere conditions, so I wouldn't say there's a total absence of evidence of ocean-atmosphere coupling, but the evidence is not as strong as we might expect for such a warm central-eastern tropical Pacific.
Thanks Nathaniel for that…
Thanks Nathaniel for that explanation!
My pleasure!
My pleasure!
Thank you!
This is some great educational content. Thanks for putting this out there!
El Niño Effects this winter in SE CA, e.g. Coachella Valley
Planning to spend the winter in Palm Springs, but extreme rain and flooding could change our plans. Any predictions for this area?
If you look at historical El…
If you look at historical El Nino cases, there is a lean toward wetter conditions for southern CA region. With that said keep in mind that ENSO has its greatest relationships with the seasonal (3month) average, so you can even have dry weeks even while the season as a whole is wetter than average. Palm Springs has a bit of a rain shadow effect too (I believe) with the mountains located right there, so it's possible that its not as sensitive to El Nino as more coastal regions. I'm not entirely sure so you may want to contact a local weather expert.
El Niño effects this winter in SoCal
Thanks Michelle, appreciate your input.
Alaska
Thank you! You guys rock! What will this look like for Anchorage, AK winter this year? More snow or rain events? Thank you
Hello! Here's a post about…
Hello! Here's a post about Alaska & ENSO. The Climate Prediction Center's most recent outlook calls for a warmer-than-average winter for Alaska.
El Nino is Peaking.
El Nino is finally peaking with a value of +1.9°C, which is just close enough to ''Historically Strong El Nino" threshold, or say +2.0°C. But nonetheless, we're now entering into a weakening El Nino as the Nino index is now dropped back to +1.26°C, which might be giving us a signal about upcoming possible La Nina by mid August or early September. Thank God, this wasn't as strong as 2015 El Nino, where the temps peaked at +2.6°C (which represents the strongest El Nino ever in human history"). By February, we would be dropping back to a Moderate El Nino, then a Weak El Nino by April, Neutral conditions by May and La Nina conditions by mid August/Early September. US now needs to watch out for 2024 Atlantic Hurricane Season. All the best for your preparations.
El Niño Tresholds
Thanks for the information. I have a question, the moderate, strong, and very strong El Niño tresholds are still informal?
The thresholds we use for…
The strength categories are not officially defined (unlike the thresholds for when we declare a La Nina or El Nino.) But the informal thresholds we use for calling an event weak, moderate or strong are as follows:
Anomalies:
0.5 - 1.0: Weak
1.0 - 1.5: Moderate
> 1.5: Strong
(make these anomalies negative for La Nina)
Comments have been disabled on this article