Already a threat to fish, mussels, and other marine creatures, low-oxygen “dead zones” are expected to increase in both size and number as greenhouse gas concentrations and global temperatures continue to rise.
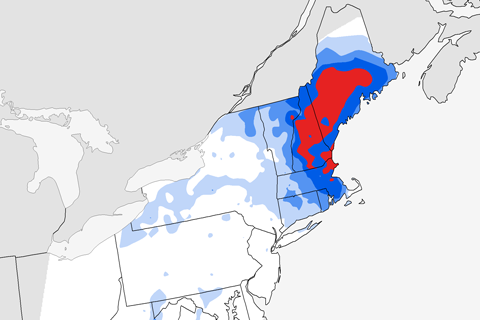
A major winter storm was still blustering its way through the U.S. Northeast this morning, with continued snow accumulations and high winds predicted for many areas. How will this event compare to the region’s most historic storms?
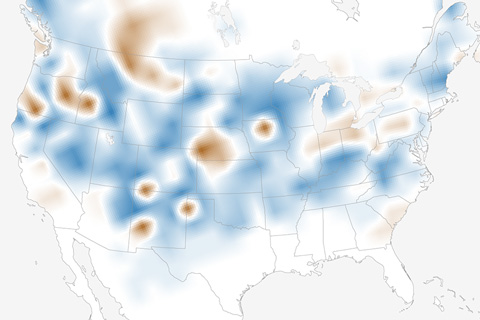
Just for fun, we asked the experts at the Rutgers Snow Lab to show us what their data (based on NOAA satellite images) had to say about whether the number of snow-covered days during the week of Christmas has changed at all across the U.S. in the past 50 years.
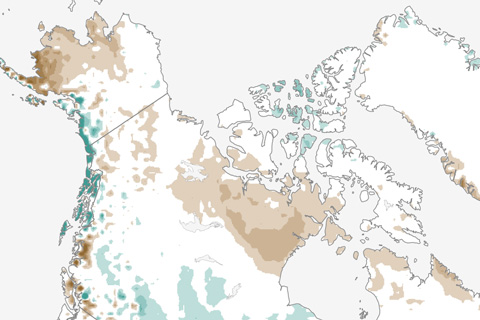
April snow extent was record low across Europe and Asia, and in June, the entire Northern Hemisphere was below average for the tenth year in a row. Spring snow is disappearing even more rapidly than Arctic sea ice in summer.
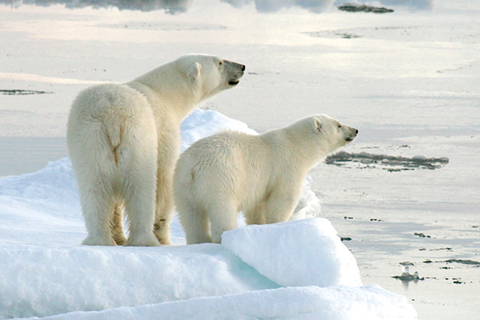
Sea ice changes are key to polar bear health and numbers. Only one of the evaluated groups is increasing. Several are stable; a few are already declining
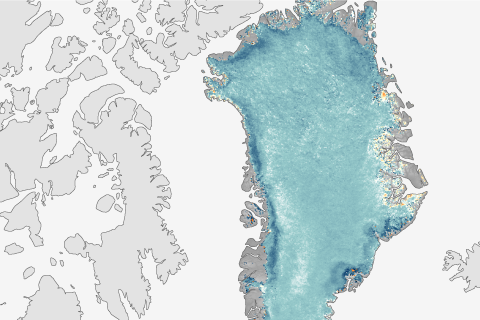
Punctuating a trend of declining reflectivity, the Greenland Ice Sheet reflected less sunlight in August 2014 than it did in any previous summer on record.
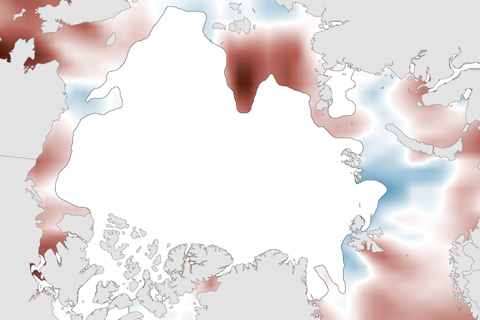
Compared to 2012’s extreme warmth, surface water temperatures were more moderate in summer 2014. Nevertheless, pockets of very warm temperatures existed.
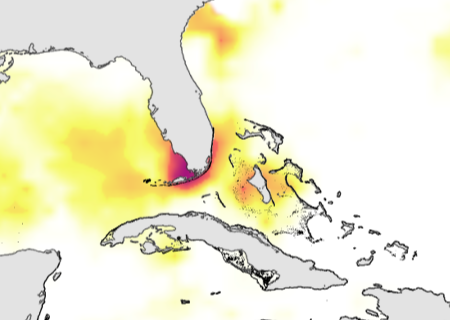
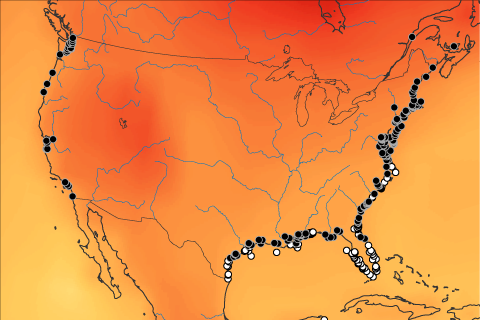
From Hawaii to the Florida Keys, the surprising intensity of coral heat stress in 2014 has scientists wondering what to expect in 2015, when El Niño is forecasted to finally develop.
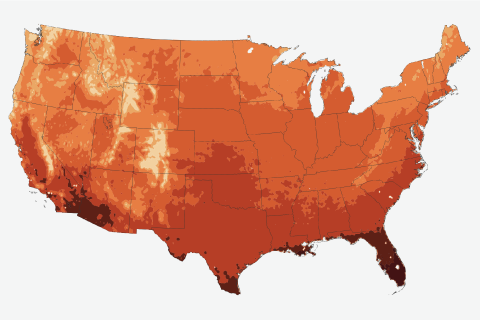
Warmer winters or hotter summers: which will have greater influence on U.S. energy demands this century?
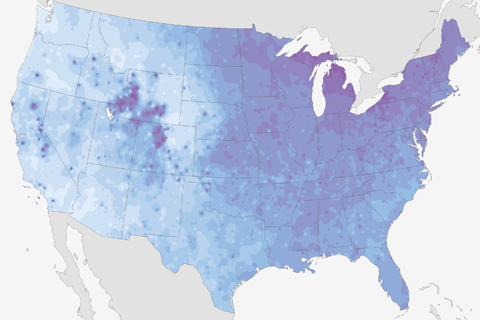
For some states, the coldest day of the year usually occurs near the start of winter, while for others it comes near the end. This map reveals when history says your state will have its coldest day of the year.