Reflectivity of Greenland Ice Sheet in late summer hit new low in 2014
Details
If you spend a long day in the summer sunshine, you can keep yourself a little cooler by wearing white. In contrast to darker colors, white reflects most of the Sun's light back into space. What's true for fabric is also true for the snow and ice blanketing Greenland: The closer it is to pure white, the less energy it absorbs. In the past decade, warming and loss of snow have combined to make Greenland's icy surface less reflective.
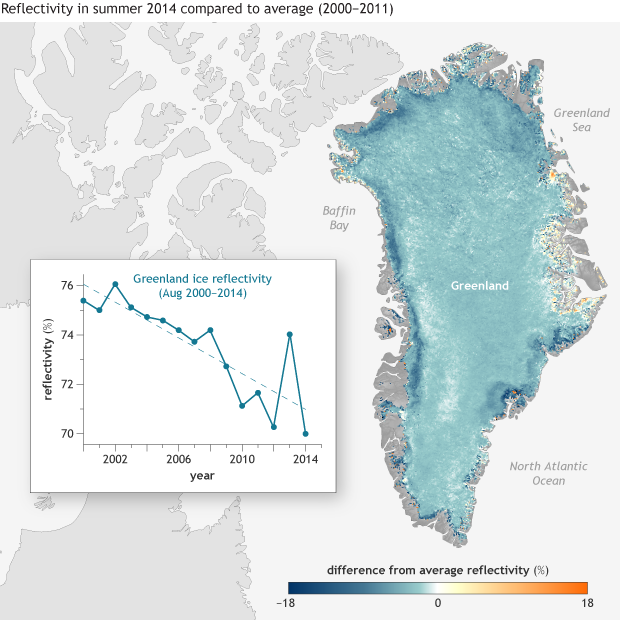
The map at right shows the percent of sunlight light reflected by the Greenland Ice Sheet in summer (June-July-August) 2014 compared to the 2000-2011 average. Areas reflecting less energy than average appear in shades of blue, areas reflecting more energy than average appear in shades of orange, and areas where reflectivity was near average are white. Some areas along the coast reflected the same amount of energy as average, and some isolated spots reflected more energy, but most of the entire ice sheet was less reflective than average.
The inset is a graph showing Greenland's average reflectivity in August, the end of the summer melt season, from 2000 through 2014. (The scientific term for the percent of incoming light an object reflects is albedo.) The long-term trend is plotted as a dotted line, and the values for individual years are plotted as a solid line. Punctuating a trend of declining reflectivity, the Greenland Ice Sheet was darker in August 2014 than in any previous summer. All data are derived from NASA's Moderate-resolution Imaging Spectroradiometer (MODIS)
The Arctic Report Card: Update for 2014 states that the Greenland Ice Sheet's overall 2014 summer reflectivity was the second lowest (exceeded only by 2012) since MODIS records began in the year 2000. August 2014 reflectivity dipped to especially low levels at high elevations. Such low reflectivity values had not previously been observed so late in summer during the MODIS period.
Greenland Ice Sheet reflectivity has dropped as air temperatures in the Arctic have risen. The Arctic Report Card: Update for 2014 reads, "Data from January-July 2014 suggest that 2014 might become the warmest year in the Arctic since the beginning of the 20th century."
Rising temperatures can darken the Greenland Ice Sheet in multiple ways. One way is that warmer temperatures cause snow and ice crystals to merge into larger grains with smoother, rounder edges, making the snowpack less reflective. If the snow and ice get warm enough to melt, the surface of the ice sheet becomes littered with melt ponds that are also less reflective than fresh snow.
Another way warmer temperatures cause darkening is through loss of snow cover. As the topmost layer of snow melts, older snow is exposed. These previous seasons’ snows, called firn, are less reflective than fresh snow. Where the ice sheet’s snowy blanket melts away altogether, bare ice is exposed. The bare ice is even less reflective than firn. In many places along the margin of the ice sheet, the exposed ice also contains impurities like embedded dust and soot, which darken the surface still further.
Compared to the 1981-2010 average for surface melting, June-July-August 2014 melt on the Greenland Ice Sheet was above normal across most of the ice sheet. By August 21, 2014, surface melt surpassed the 1981-2010 average by two standard deviations.
Caption by Michon Scott. Map and graph by NOAA Climate.gov and Fiona Martin, based on data provided by Jason E. Box, Geological Survey of Denmark and Greenland.
References
M. Tedesco et al. (2014). Greenland Ice Sheet. In Jeffries, M.O., Richter-Menge, J., Overland, J.E. (2014) Arctic Report Card: Update for 2014.
Lindsey, R. (2011, December 29). Greenland Ice Sheet Getting Darker. Climate.gov.
National Snow and Ice Data Center. Thermodynamics: Albedo. Accessed December 8, 2014.