ENSO and tornadoes
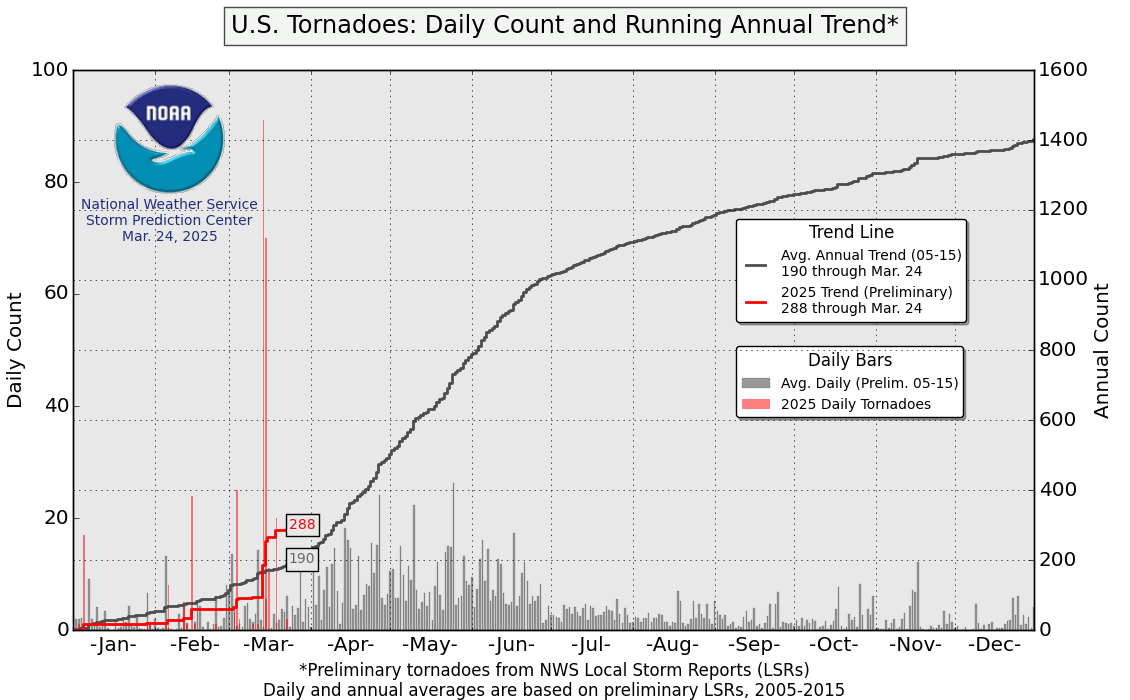
The 2017 U.S. severe weather season has jumped out to a fast start with above-average numbers of tornado, hail and wind reports. (Check out NOAA’s Storm Prediction Center for severe weather reports and summaries.) Most of the tornadoes reported were in the southern U.S., relatively close to the warm waters of the Gulf of Mexico, but several tornadoes touched down unusually far north for this time of year, including 2 EF-1 tornadoes in Massachusetts on Feb 25, 2017 and 3 EF-1 tornadoes in Minnesota on March 6, 2017.
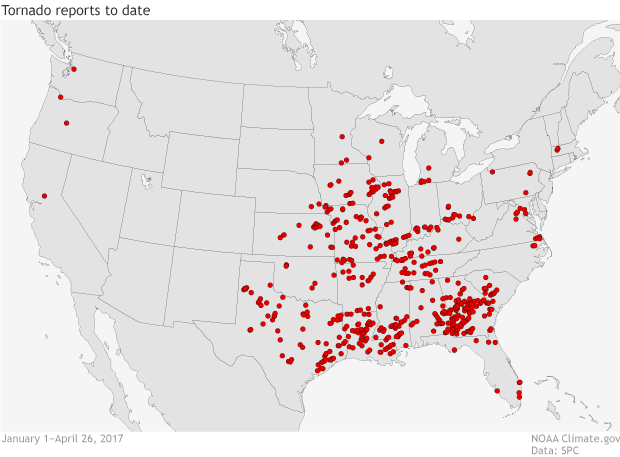
2017 year-to-date tornado reports. Map by climate.gov from Storm Prediction Center data.
Is there a reason for the recent spate of U.S. severe weather? What makes one season or year have more tornadoes than another? Can we blame ENSO? Since this is the ENSO blog, that’s the question that we’ll tackle here.
ENSO and tornadoes: signal vs. noise
First of all, this year’s active start does not necessarily mean that 2017 will be a busy year for tornadoes. In recent years, there has been little relationship between the number of tornadoes that occur early in the year (January – March) and the eventual annual total. Active years (e.g., 2004) can start slowly, and fast-starting years (e.g., 2012) can turn out to be relatively inactive.
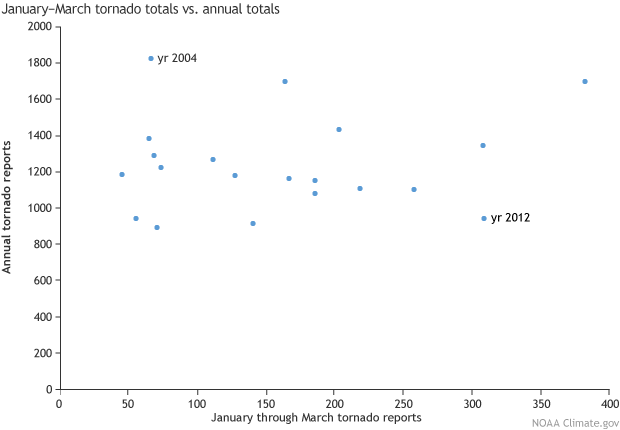
Scatter plot of the number of January-March tornado reports versus the annual number of tornado reports from 1996-2015. Figure by climate.gov; data from the authors.
As you’ve heard repeatedly in this blog (here and here, for example), ENSO shifts the atmospheric circulation (notably, the jet stream) in ways that affect winter temperature and precipitation over the U.S. The changes in spring (March – May) are similar to those during winter, but somewhat weaker.
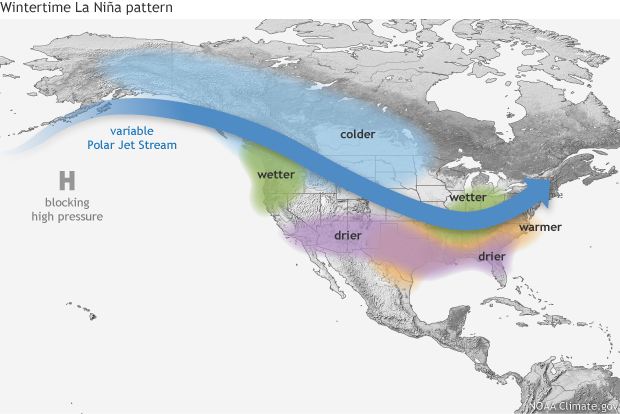
Typical impacts of La Niña on U.S. winter temperature and precipitation. Such impacts have been associated with past episodes, but all impacts aren't seen with every episode. NOAA Climate.gov drawing by Fiona Martin.
These shifts would also be expected to impact thunderstorm activity: El Niño tends to shift the jet stream farther south over the U.S., which blocks moisture from the Gulf of Mexico, reducing the fuel for thunderstorms. On the other hand, La Niña is associated with a more wavy and northward shifted jet stream, which might be expected to enhance severe weather activity in the south and southeast. Indeed, historic tornado outbreaks in 1974, 2008 and 2011 started during La Niña conditions.
However, tornado and severe weather activity is more variable (“noisier” and harder to predict) than ordinary weather (think temperature and precipitation), and any ENSO signal is harder to see. Until recently, the only solid evidence showing that more tornadoes occur during La Niña conditions was for winter (January-March), when the ENSO signal is strongest, but average tornado activity is relatively low (Cook & Schaefer, 2008).
A recipe for tornadoes
A clearer picture of the impact of ENSO emerges when we look at the ingredients that are conducive to tornado and thunderstorm occurrence (Allen et al., 2015a). Instead of only looking at individual weather events, it’s important to consider the environmental cues for the outbreak of severe weather.
Two important ingredients for tornadoes are atmospheric instability (e.g., warm, moist air near the surface and cool dry air aloft) and vertical wind shear (winds at different altitudes blowing in different directions or speeds). Measures of these tornado-friendly ingredients can be combined into indexes that are less noisy than actual tornado reports and let us see how the phases of ENSO make the environment more or less favorable for severe weather (footnote 1).
In much of the U.S., La Niña conditions are associated with increases in these environmental factors and in tornado and hail reports. The largest signal is present in the south and southeast (including parts of Texas, Oklahoma, Kansas, Louisiana, Arkansas, and Missouri), except in Florida where the opposite relation is observed. Positive values indicate increased activity, and negative values indicate decreased activity compared to the long-term average (1979-2015).
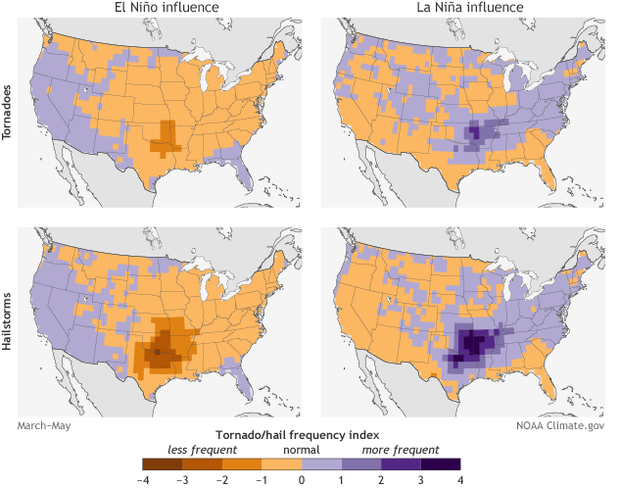
March-May values of a blend of tornado and hail reports with a tornado environment index (TEI) and a hail environment index (HEI) for El Nino and La Nina years. Maps by climate.gov; data from the authors.
In the South and Southeast, where the signal is strongest, we see a clear shift in activity with ENSO phase, but with a tremendous range of variability, meaning some El Niño years still have high severe weather activity, and some La Niña years are relatively inactive. While increased tornado activity is generally associated with La Nina conditions, blaming this year’s high activity on the weak La Nina conditions would be exaggerating the strength of the historical relationship (footnote 2).
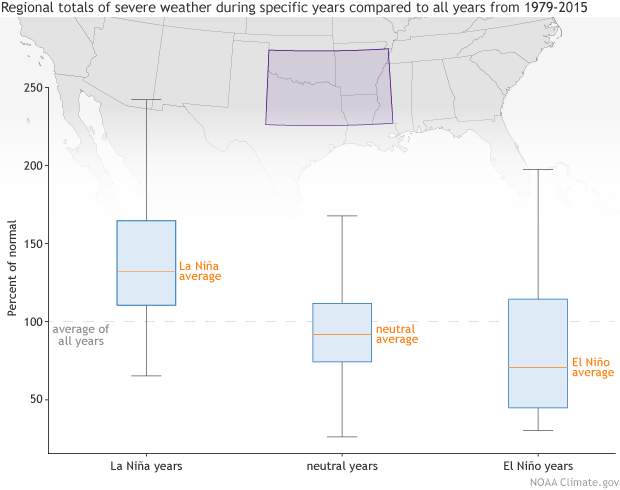
Regional (100-90W, 31-36N) totals of March-May tornado reports, hail events, a tornado environment index (TEI) and a hail environment index (HEI) expressed as percentage of their 1979-2015 average and conditioned on the ONI. Box edges mark the 25th and 75th percentiles, and whiskers extend 1 and a half times the interquartile range. Figure by climate.gov; data from the authors.
Seasonal prediction?
So far, we’ve considered the simultaneous relationship between ENSO and severe weather activity. However, the state of ENSO is fairly persistent from winter to early spring, and the correlation of the December-February value of the Oceanic Niño Index (3-month average of Niño-3.4 SSTs) with the subsequent March-May value is 0.87. So, it might be possible to use the ENSO state of the previous winter to predict spring severe thunderstorm activity.
However, there is tremendous variability in severe thunderstorm activity that is unexplained by ENSO. For most people, a seasonal tornado forecast would be a good reminder to be prepared and pay attention to local weather forecast office warnings, but would not be specific enough to take other action. On the other hand, such a forecast might be of value to organizations and businesses (think insurance, for whom the risk from thunderstorms is nearly as high as from hurricanes; Gunturi & Tippett, 2017) with wide exposure and the ability to act on uncertain information.
Lead reviewer: Emily Becker
Footnotes
1: The tornado environment index (TEI) and hail environment index (HEI) are functions of monthly averages of convective precipitation, convective available potential energy and storm relative helicity. TEI and HEI are calibrated to match the recent climatology of tornado numbers and hail events. See Tippett et al. (2012) and Allen et al. (2015b) for more details.
2: Inside baseball: Further details of the ENSO relation
Overall, La Nina conditions are associated with enhanced U.S. tornado activity, but more detailed aspects of ENSO may also be relevant (Lee et al., 2012). Gulf of Mexico sea surface temperature is close to the part of the U.S. most strongly impacted by severe weather: warm Gulf of Mexico surface water in spring enhances low-level moisture transport and southerly flow and is associated with enhanced US tornado and hail activity (Molina et al., 2016). Gulf of Mexico sea surface temperature is negatively correlated with tropical Pacific sea surface temperature, meaning when the tropical Pacific is cooler than average (La Niña), the Gulf of Mexico is usually warmer than average.
Seasonal (May-July) averages of Gulf of Mexico SST can be predicted with some skill (Jung and Kirtman, 2016). Atmospheric angular momentum is related to ENSO and also shows the impact of tropical forcing on tornado activity (Gensini and Marinaro, 2016).
References
Allen, J. T., M. K. Tippett, and A. H. Sobel, 2015a: Influence of the El Nino/Southern Oscillation on tornado and hail frequency in the United States. Nat. Geosci., 8, 278–283, doi:10.1038/ngeo2385.
Allen, J. T., M. K. Tippett, and A. H. Sobel 2015b: An empirical model relating U.S. monthly hail occurrence to large-scale meteorological environment, J. Adv. Model. Earth Syst., 7, 226–243, doi:10.1002/2014MS000397.
Cook, A. R., and J. T. Schaefer, 2008: The Relation of El Nino–Southern Oscillation (ENSO) to Winter Tornado Outbreaks. Mon. Wea. Rev., 136, 3121–3137, doi:10.1175/2007MWR2171.1.
Gensini, V. A., and A. Marinaro, 2016: Tornado frequency in the United States related to global relative angular momentum. Mon. Wea. Rev., 144, 801–810, doi:10.1175/MWR-D-15-0289.1.
Gunturi, P., and M. K. Tippett, 2017: Managing severe thunderstorm risk: Impact of ENSO on U.S. tornado and hail frequencies. Tech. rep., WillisRe.
Jung, E., and B. P. Kirtman, 2016: Can we predict seasonal changes in high impact weather in the United States? Environ. Res. Lett., 11, 074 018.
Lee, S.-K., R. Atlas, D. Enfield, C. Wang, and H. Liu, 2012: Is there an optimal ENSO pattern that enhances large-scale atmospheric processes conducive to tornado outbreaks in the United States? J. Climate, 26, 1626–1642, doi:10. 1175/JCLI-D-12-00128.1.
Molina, M. J., R. P. Timmer, and J. T. Allen, 2016: Importance of the Gulf of Mexico as a climate driver for U.S. severe thunderstorm activity. Geophys. Res. Lett., 43, 12,295–12,304, doi:10.1002/2016GL071603.
Tippett, M. K., A. H. Sobel, and S. J. Camargo (2012), Association of U.S. tornado occurrence with monthly environmental parameters, Geophys. Res. Lett., 39, L02801, doi:10.1029/2011GL050368.
Comments
Seasonal tornado forecast
Comments have been disabled on this article