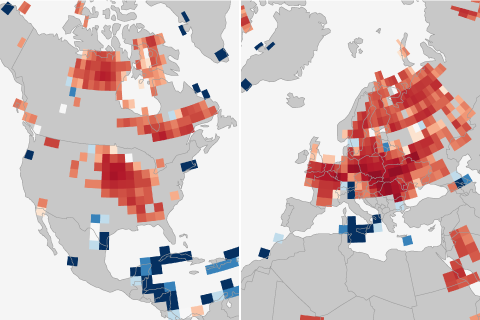
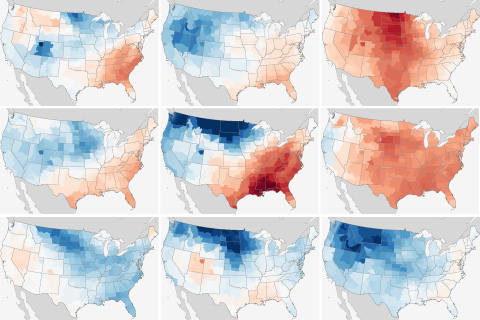
Across much of the mid-latitudes, models estimate that the converting forests to farms and rangeland shortened the return period for extremely hot, dry summers: from every 10 years to every 2-3 years.
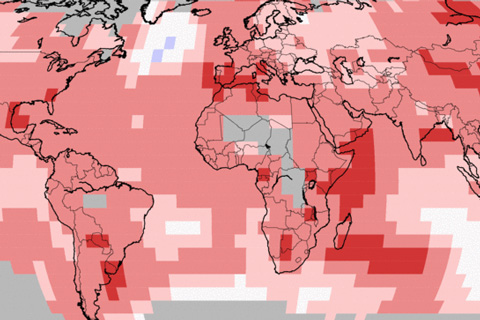
The eastern tropical Pacific was cooler than average, but much of the rest of the globe experienced a warmer than usual September in 2017. The year to date has been the second warmest on record.
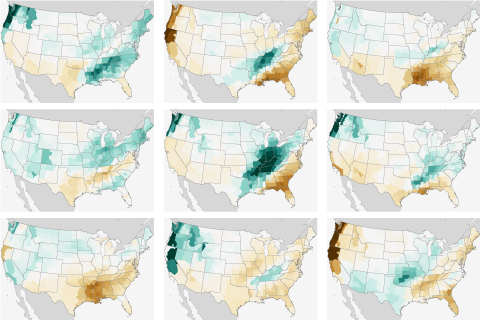
What were precipitation amounts during winter like across the U.S. during every La Niña on record? We've got the answer right here.
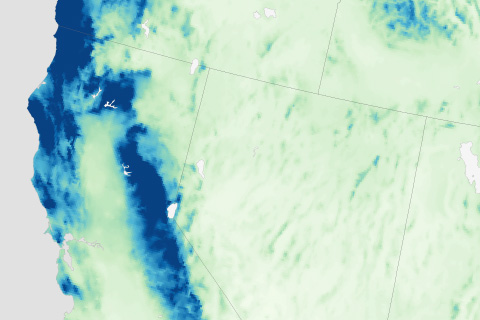
The very wet 2016-2017 water year came to an end in California on October 1.
How has La Niña affected U.S. winter temperatures during every episode on record? We've mapped them all.
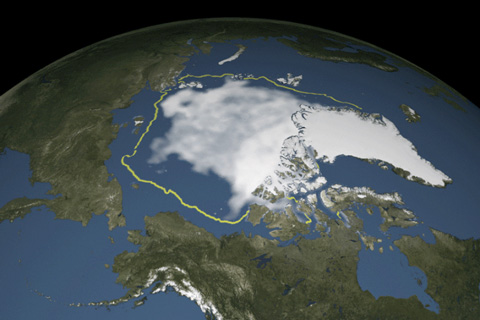
Although the winter maximum ice extent in March 2017 was the smallest on record, the summer minimum didn't follow suit. This summer's minimum ice extent was the eighth smallest on record, continuing the long-term trend of sea ice loss, but not setting a new record.
Malaria is among the world's deadliest diseases. Rising temperatures in Ethiopia are expanding malaria risk zones.
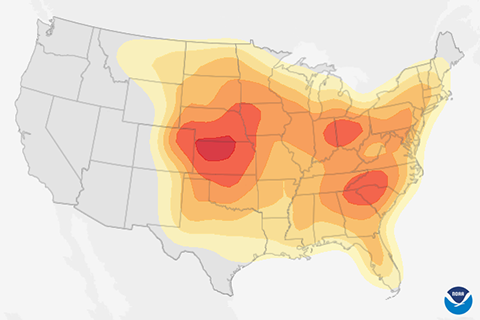
April showers bring May flowers, but what does June bring? History says mid-to-late June brings a higher probability of severe weather across much of the contiguous United States.
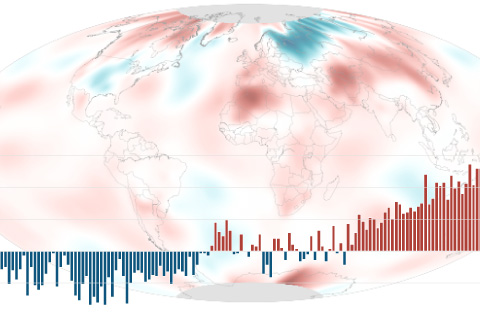
The May temperature across global land and ocean surfaces was 1.49°F above the twentieth-century average of 58.6°F. Since 1880, May temperatures have been rising by 0.13°F (0.07°C) per decade.
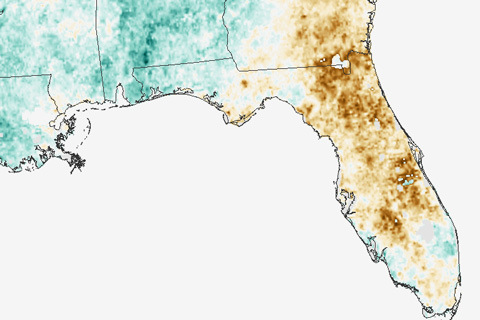
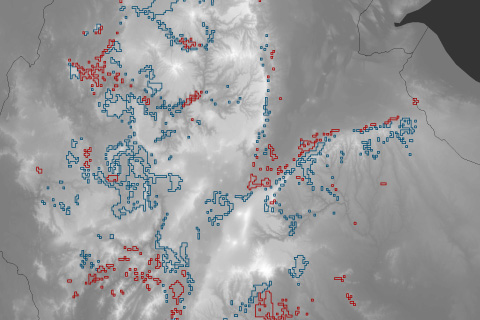
At the end of May 2017, central Florida was the only part of the contiguous United States experiencing extreme drought. These maps come from a new drought surveillance system that can detect vegetation stress without knowing anything about how much it has rained.