March 2020 ENSO update: puzzle time
The ocean surface in the central tropical Pacific has been warmer than the long-term average for a few months now, but overall the ocean-atmosphere system is still in neutral—neither El Niño nor La Niña. The El Niño/Southern Oscillation (ENSO) forecast team estimates about a 65% chance that the tropical Pacific will continue in ENSO-neutral this spring, and about a 55% chance neutral will remain through the summer. We’ll take a spin through the current situation, and lay out some of the puzzle pieces forecasters look at when assembling a picture of ENSO in the future.
Jigsaw
First, though—does anyone remember why we spend so much time and energy predicting the evolution of the temperature of the tropical Pacific Ocean? If you guessed “because El Niño and La Niña have impacts on weather and climate around the world and can be predicted in advance,” you get a gold star! While nothing is a sure bet when you’re making predictions, a developing El Niño or La Niña can provide some valuable clues about upcoming seasonal climate. For more on that, check out Tom’s post.
With that important piece of housekeeping out of the way, it’s on to current conditions. As I mentioned above, the tropical Pacific has been hovering a bit warmer than average through the winter, including in our primary monitoring region, Niño3.4. The February Niño3.4 index was 0.4°C above the 1986-2015 average, according to the ERSSTv5 dataset, our most consistent long-term record. This is just a hair below the El Niño threshold of 0.5°C warmer than average.
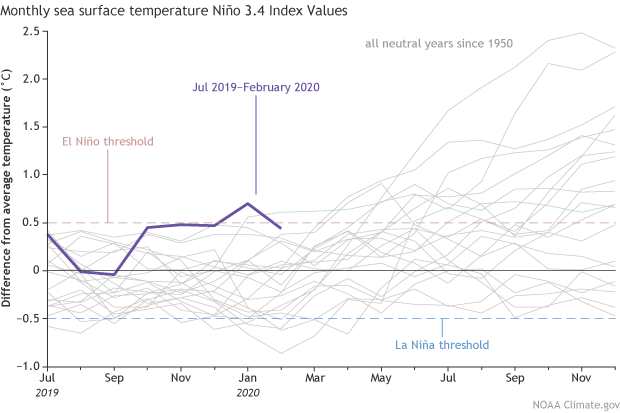
Monthly sea surface temperature in the Niño 3.4 region of the tropical Pacific for 2019-2020 (purple line) and all other years starting from neutral winters since 1950. Climate.gov graph based on ERSSTv5 temperature data.
The atmosphere in the tropical Pacific region actually looked a bit El Niño-y (El Niño-ish? These are not real words) last month, with greater-than-average amounts of rain and clouds over the central tropical Pacific, and less over Indonesia. Also, the near-surface winds over the western tropical Pacific were weaker than average.
However, some atmospheric features are not consistent with El Niño, such as the atmospheric pressure difference at sea level between Tahiti and Darwin, which is known as the Southern Oscillation Index. Also, most computer models predict we’ll remain ENSO-neutral (neither El Niño nor La Niña) in the coming seasons. I went into more detail about the forecast process last month—this month was quite similar, so head over to that post if you would like more information.
Brain teasers
Getting into late summer and next fall, though, some models predict that the Niño3.4 index could drop below the La Niña threshold of 0.5°C cooler than the long-term average. So are we gearing up for La Niña next winter? Perhaps, but we’re giving it lower odds. Forecasters are putting the odds of La Niña at around 35-40% by next fall, but there are reasons why we’re not giving La Niña a big edge.
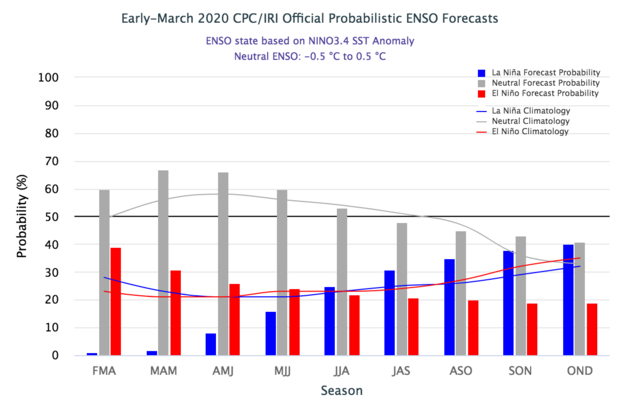
Official CPC/IRI forecast of the odds of El Niño, neutral ENSO and La Niña conditions issued in mid-March.
First, check out that Niño3.4 graph a few paragraphs up. The gray lines show every year since 1950 that started from an ENSO-neutral winter like the one we’ve just had. In 22 examples, La Niña has not followed a neutral winter once! Does that mean it’s impossible? Definitely not! But it would be something we haven’t observed before.
Another consideration is the spring predictability barrier. Forecasts made in March, April, and May tend to be less reliable than forecasts made during the rest of the year. This is partly because spring is often a transition time between El Niño, La Niña, and neutral. Also, the tropical Pacific has a particularly narrow temperature range in the spring, with only about 2°C separating the warmest spring Niño3.4 and the coolest. For comparison, the range in winter is more than 5.5°C. Predicting a small change is tougher than predicting a larger one, contributing to the spring barrier.
Trivia night
We’re always looking for more context to interpret model predictions, especially in the spring. An interesting study by friend-of-the-Blog Mike Tippett, of Columbia University, shows that the tendency of the Niño3.4 index in the spring does not have a strong relationship with the tendency through the summer. By “tendency” I mean the direction of the month-to-month change in Niño3.4 temperature. So, if the March Niño3.4 sea surface is cooler than February, that would be a cooling tendency. Mike compared the tendency in February–March to that in April–July.
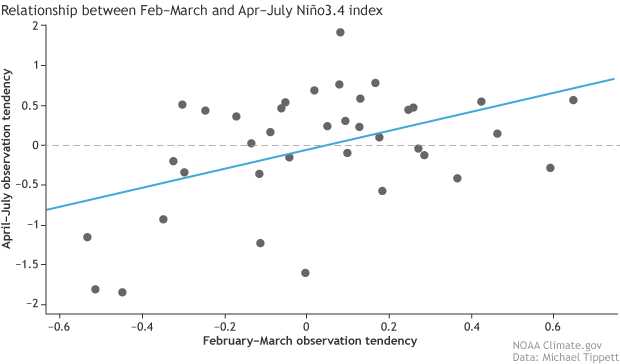
The relationship between the February–March tendency of the Niño3.4 Index to the April–July tendency. Tendency is the change between February and March, or April to July. The blue line indicates the linear regression model that best fits the data. If the relationship between these two tendencies were very strong, the dots would lie close to the line. If there were no relationship at all, they would be scattered randomly all over the graph. Figure by climate.gov from Mike Tippett’s data.
He found that the relationship between spring and summer tendencies is not particularly strong (see footnote*). And, when the spring tendency is very small, it provides even less information about the summer. We don’t yet know what the March Niño3.4 index will be, but it’s likely that it will be very close to February, meaning a tendency close to zero. In the past, a February–March with little change has preceded a wide variety of April–July outcomes. So, while this may help us make predictions in future springs, currently we are not seeing a strong favorite for upcoming ENSO conditions.
The spring barrier will hang around through May, but we’re here year-round. Thanks for checking in. You can look forward to Michelle taking the helm for the April ENSO Update!
* Mike used linear least squares regression, which finds the closest fit of a line to the scatter points in the graph. He found a correlation between the Feb–Mar and Apr–Jul tendencies of 0.46. A correlation of 0.46 equals an explained variance of about 21%: meaning about 21% of the behavior of the Apr–Jul tendency can be predicted based on Feb–Mar.
Comments
Excellent Blog
RE: Excellent Blog
Thanks, Victor!
Not real words
Global dimming
RE: Global dimming
Nino vs Nina
El Nino
Thanks
Global Dimming
Thanks
blogs
We don’t yet know what the March Niño3.4 index will be, but it’s likely that it will be very close to February, meaning a tendency close to zero. In the past, a February–March with little change has preceded a wide variety of April–July outcomes.
Comments have been disabled on this article