November 2017 La Niña update: She’s back!
Well, it’s November, and the CPC/IRI ENSO forecast is declaring the presence of La Niña conditions! I could just link to my November 2016 post and head home for the day… but that would be no fun! There’s about a 65-75% chance that La Niña conditions will continue at least through the winter. As we head into our fifth “double dip” La Niña (an unofficial term for when neutral conditions briefly prevail in between La Niña winters) in the historical record, let’s dig into what we talk about when we talk about La Niña.
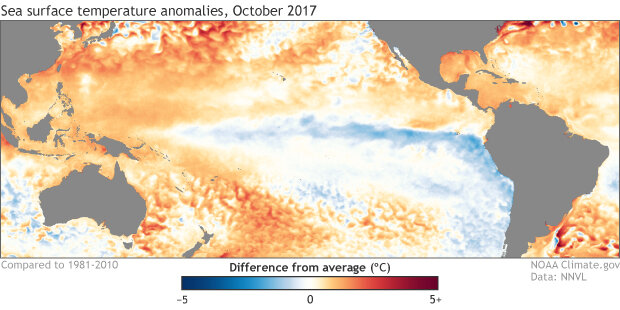
October 2017 sea surface temperature departure from the 1981-2010 average. Graphic by climate.gov; data from NOAA’s Environmental Visualization Lab.
A quick flashback
If you recall, last month there were several signs of the presence of La Niña conditions. East-central tropical Pacific sea surface temperatures were cooler than the long-term average, accompanied by signs of a La Niña-like atmospheric response (more clouds and rain over Indonesia, less over the central Pacific).
Sea surface temperatures in the Niño3.4 region during September came in at about 0.5°C cooler than the long-term average, the first step in our La Niña conditions decision tree. However, the sea surface temperature was showing some volatility, and we just weren’t confident enough in the second step of the flowchart—that the cooler sea surface would persist for several seasons—to be sure that La Niña’s seasonal pattern had locked in.
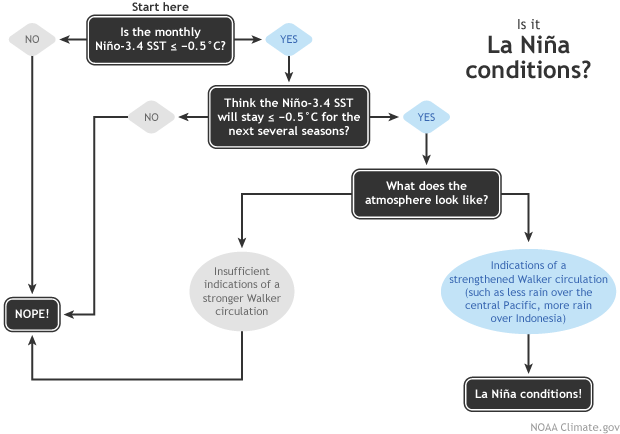
Flowchart showing decision process for determining La Niña conditions. Figure by Fiona Martin, adapted by Climate.gov.
What’s different this month?
In October, despite an active Madden-Julian Oscillation moving through the western Pacific (more on that in a minute), La Niña conditions dominated. Stepping through our flowchart, the sea surface temperature in the Niño3.4 region again averaged about 0.5°C cooler than average (check). Most of the computer models forecast that it will remain in weak La Niña territory (between 0.5°C and 1.0°C below average) through the spring (check).
Another factor bolstering forecasters’ confidence that La Niña will remain in place through the fall and winter 2017/18 is the substantial quantity of cooler-than-average waters below the tropical ocean surface. This will provide a source of cooler waters to the surface over the next few months.
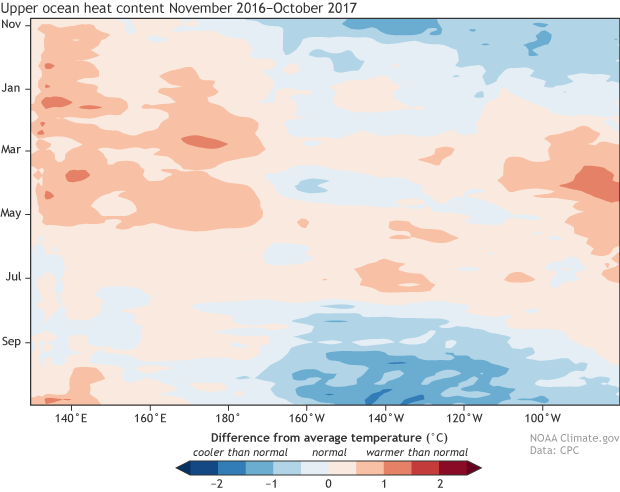
Heat content in the upper few hundred meters of the tropical Pacific (5°N-5°S) from November 2016 (top of image) through October 2017 (bottom of image). Each row in this type of image is the departure from average (1981-2010) at that time. NOAA Climate.gov image, based on data provided by the Climate Prediction Center.
Finally, the signs of an atmospheric response I described above continued to be present during October (check). In addition to the clouds and rain pattern, the upper-level winds were stronger than average, another sign of a strengthened Walker Circulation. Also, the Southern Oscillation Index was positive, also indicating a stronger-than-average Walker Circulation. Add it all together, and you get… La Niña!
You promised me an MJO!
Indeed I did. The Madden-Julian Oscillation operates on subseasonal timescales, meaning on the order of weeks or months. The MJO is essentially an area of enhanced convection, storms and clouds that moves eastward along the equator, and can circle the globe in around 4-8 weeks. ENSO (the whole El Niño/La Niña system), on the other hand, is a seasonal, stationary pattern, lasting for at least several months in a row.
The MJO can move through the tropical Pacific and temporarily change conditions, including the winds near the surface.
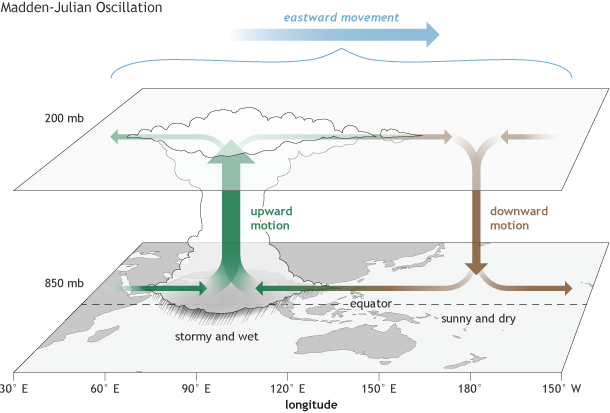
The surface and upper-atmosphere structure of the MJO for a period when the enhanced convective phase (thunderstorm cloud) is centered across the Indian Ocean and the suppressed convective phase is centered over the west-central Pacific Ocean. Horizontal arrows pointing left represent wind departures from average that are easterly, and arrows pointing right represent wind departures from average that are westerly. The entire system shifts eastward over time, eventually circling the globe and returning to its point of origin. Climate.gov drawing by Fiona Martin.
The near-surface winds in the tropics, called the trade winds, have a close relationship to the surface temperature of the ocean. The trades normally blow from east to west, helping to cool the surface and keep warmer water “piled up” toward Indonesia. If these winds relax, the surface waters in the central and eastern Pacific can warm up. This is a critical feedback mechanism for ENSO.
During La Niña, the trade winds are stronger than average, keeping the surface waters cooler (vice versa during El Niño). If the MJO is active, it can temporarily change the wind patterns. This past month, the MJO was active and moved through from the Indian Ocean into the western hemisphere, weakening the surface winds. But despite the winds temporarily weakening due to the MJO, the ocean remained cool. This leads forecasters to believe that La Niña conditions are in place and we can now see the forest for the trees.
This winter’s La Niña, although expected to remain weak, is likely to have some effect on North American weather and climate this winter. Be sure to check out Mike’s recent post for details on NOAA’s 2017/18 Winter Outlook, and stay tuned to the ENSO Blog for further updates on the great La Niña of 2017/18.
Comments
Winter 2017-18 NYC Metro area
RE: Winter 2017-18 NYC Metro area
Hi Kevin,
As you can see from the previous ENSO Blog post (https://www.climate.gov/news-features/blogs/enso/winter-coming-noaa%E2%…), NOAA CPC is calling for elevated probabilities of above normal temperatures in the New York metro area, although the signal for warmth is not as strong as in areas farther south. CPC does not issue seasonal outlooks for snowfall. One reason is that it is very tricky to forecast snowfall over most regions that typically receive a few snowstorms or less each year. You're right that the NYC region has experienced above average snowfall the past few winters despite the last two being quite mild. As you probably recall, most of the snowfall two winters ago occurred in one big snowstorm in January. The sensitivity of seasonal snowfall totals to individual storms illustrates how challenging it is to forecast seasonal snowfall over many regions.
Applied Meteorology
this post, and the ENSO blo
Thaks for the article. We
"La Nina conditions" does not mean we're in a "La Nina."
RE: "La Nina conditions" does not mean we're in a "La Nina."
Hi Ric,
I understand your point. According to NOAA's criteria for defining an El Nino or La Nina event, we will not be certain whether or not an ENSO event officially occurred until at least 5 overlapping seasons with ENSO conditions have passed. However, NOAA issues a La Nina Advisory when recent conditions satisfy La Nina conditions, and the expectation is that these conditions will persist long enough to satisfy the duration requirement. This is what happened a few days ago - an official La Nina Advisory was posted. So technically, I suppose the message is that "La Nina conditions are here and expected to continue." From a practical perspective for the purpose of preparing the general public and users of climate prediction information, I am not sure if that message would be much different from "La Nina is back." So while I appreciate your point, I am hopeful that the main message is being reached by those who are most impacted by the La Nina Advisory.
RE: "La Nina conditions" does not mean we're in a "La Nina."
RE: RE: "La Nina conditions" does not mean we're in a "La Nina."
Hi Ashok,
As Nathaniel noted in the comment above, NOAA issues a La Nina Advisory when recent conditions satisfy La Nina conditions, and the expectation is that these conditions will persist long enough to satisfy the duration requirement. So the question is not whether ASO qualified as a La Nina but if scientists believe La Nina conditions are present in the ocean and atmosphere and that those conditions will last long enough (5 consecutive three-month periods) to qualify using the standard definition.
This brings up another important point about why we issue La Nina Advisories now. The 5-consecutive three month period definition is one applied after the event is over. For the public to prepare for an event, there needs to be an advisory that does not wait that long. This is where the La Nina advisory fits in. We would not issue a La Nina advisory if we did not think that it would fulfill the historical, 5-consecutive three month period of SST's below -0.5C.
Winter forecast prediction
RE: Winter forecast prediction
Debby,
The general forecast for the country was discussed in this blog post:
https://www.climate.gov/news-features/blogs/enso/winter-coming-noaa’s-2017-2018-winter-outlook
The probabilities for above, near, and below normal temperature and precipitation for the upcoming winter i your area code can be obtained here:
http://www.cpc.ncep.noaa.gov/products/predictions/long_range/interactiv…
why is there another La Nina?
RE: why is there another La Nina?
We've often seen La Nina episodes span multiple years, so having La Nina occurring in two consecutive winters isn't necessarily that unusual (for instance, 2008 / 2009 and 2011 /2012). You can see historical La Ninas in the linked table (numbers colored blue). Was is unusual is the warming in between the winters that approached El Nino. This is something we hadn't seen before, but then again, we are only looking at about 65 years of data.
http://www.cpc.ncep.noaa.gov/products/analysis_monitoring/ensostuff/ONI…
whoah this blog is excellent
John
Comments have been disabled on this article