November 2021 La Niña update: movie night
La Niña conditions reign in the tropical Pacific, with about a 90% chance of remaining through the winter. Get your popcorn and settle down on the couch—it’s time for this month’s ENSO cinema.
Romantic comedy
A recurring theme here at the ENSO Blog is the on-again, off-again relationship between the tropical Pacific Ocean and atmosphere. ENSO (short for El Niño-Southern Oscillation, the entire El Niño–La Niña system) relies on the interaction between the ocean and the atmosphere. Average conditions in the tropical Pacific (see the drawing below) consist of relatively warmer surface water in the west and relatively cooler surface in the east. Air rises over the warm western water, forming clouds and rain; winds blow west-to-east high up in the atmosphere; air descends over the cooler east; winds blow east-to-west near the surface. Dun-dun-dunnn… it’s the Walker circulation!
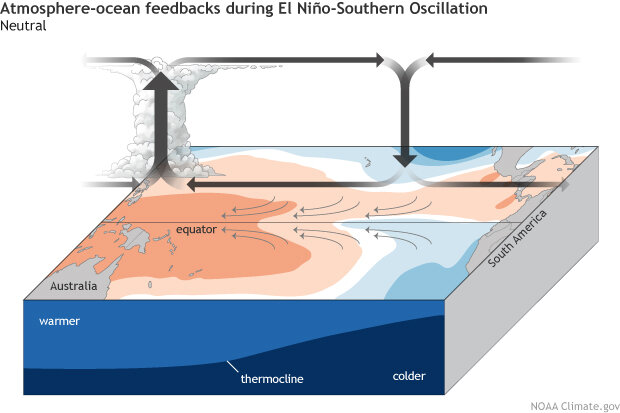
ENSO-Neutral or average conditions across the tropical Pacific Ocean. Climate.gov schematic by Emily Eng and inspired by NOAA PMEL.
When La Niña is present, the atmosphere takes one look at that characteristic cooler-than-average central/eastern Pacific ocean surface and gets all amped up. I haven’t yet seen the Walker circulation standing outside La Niña’s house holding a boombox aloft, but ENSO is always full of surprises.
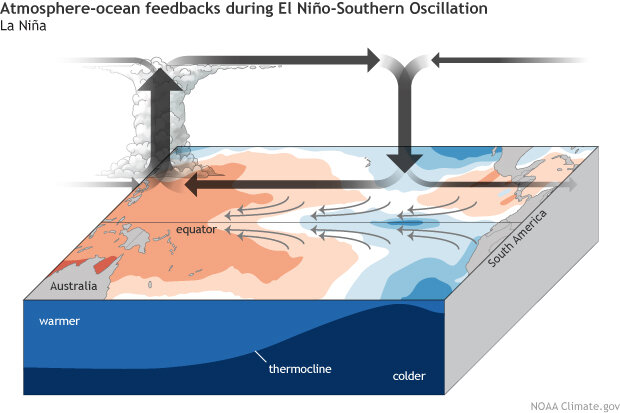
During La Niña, the surface trade winds (small gray arrows) blow more strongly than normal, piling up warm surface water in the western Pacific and drawing up deep, cool water in the eastern Pacific. Over the warm waters, the air becomes more buoyant (upward thick arrow), and rainfall increases. Over the cool waters, it is less buoyant, favoring subsidence (downward gray arrow) and less rainfall. These feedbacks between ocean and atmosphere strengthen the La Niña event. Climate.gov schematic by Emily Eng and inspired by NOAA PMEL.
The resulting stronger near-surface winds (the trade winds) reinforce the cooler ocean surface—the feedback mechanism fundamental to ENSO. For more on how this works, and a delectable bread analogy, check out Michelle’s Oscar-winning post.
All this is to say that La Niña conditions, after developing in September, continued in October. The surface of the ocean in the Niño-3.4 region, our primary ENSO-monitoring region, was about 1.0˚ C (1.8˚ F) cooler than the long-term average, via the ERSSTv5, our primary ENSO-monitoring dataset.
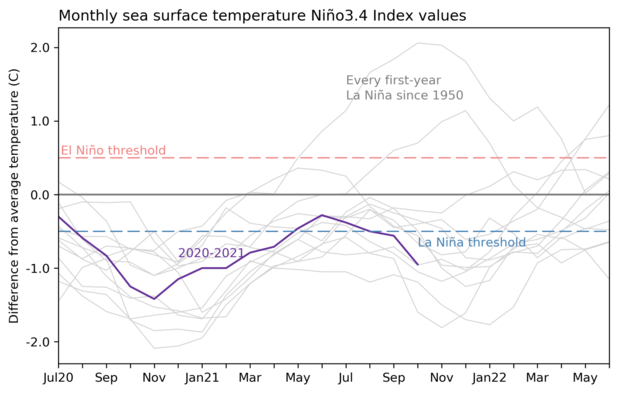
This graph shows monthly sea surface temperature anomalies (difference from average) in the Niño 3.4 region of the tropical Pacific for 2020-21 (purple line) and all other years (gray lines) starting from first-year La Niña winters since 1950. While two La Niña winters in a row is pretty common, three-peats have occurred only twice. Climate.gov graph based on ERSSTv5 temperature data.
October featured La Niña’s atmospheric conditions—more rain than average over Indonesia, less over the central Pacific, and stronger-than-average trade winds over portions of the equatorial Pacific. As in all relationships, there are ups and downs, and these patterns were a bit weaker in October than September. However, these two crazy kids are working on their relationship already, with a batch of stronger trade winds currently taking over much of the tropical Pacific.
Action-adventure
“Predictable” isn’t high praise for a movie plot, but certainly is when it comes to the weather and climate. La Niña-related changes to global atmospheric circulation, including its effect on the jet stream, give us a picture of the average weather conditions expected over the next several months. To be clear, we mean the overall average, not that every day will exhibit the same weather!
There have been 23 La Niña events (24 counting this one!) in our historical record, which goes back to 1948. If we look at the October–December rainfall patterns during those La Niñas, we find more rain than average in northern California and the Pacific Northwest, and less than average through the Gulf coast and Southeast.
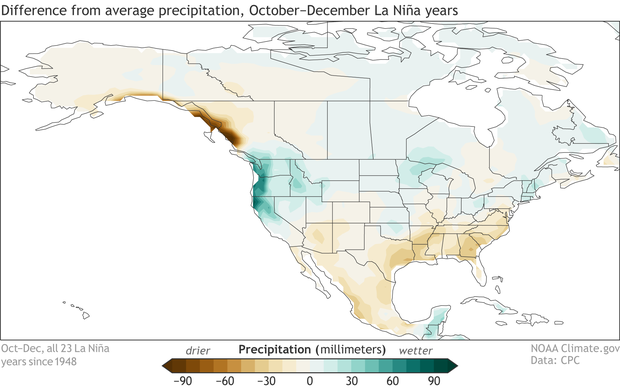
Composite of October–December precipitation during the 23 La Niña years since 1950, compared to the 1950–2020 average. Composites for other seasons and temperature are available here. Climate.gov image from CPC data.
While La Niña tends to be linked to dry conditions and drought through California and the Southwest, that pattern usually develops in December–February through the early spring. You can step through the seasons to see ENSO impacts here. The strong atmospheric river that brought so much rain and snow to northern California last month was not atypical for a La Niña autumn. Overall, the October and early November North American rainfall map looked a lot like what we might expect this time of year during La Niña.
Documentary feature
Spoiler alert! There’s about a 50% chance that La Niña will last into spring 2022 (March–May).
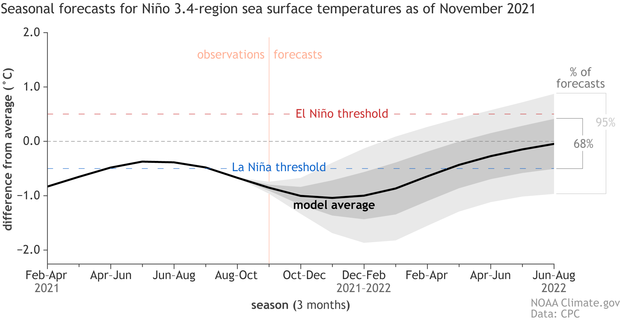
Climate model forecasts for the Niño3.4 temperature anomalies in late 2021 and 2022 . Average dynamical model data (black line) from the North American Multi-Model Ensemble (NMME): darker gray envelope shows the range of 68% of all model forecasts; lighter gray shows the range of 95% of all model forecasts. Most of the plume—that is, most of the model runs—stay beneath the La Niña threshold this winter. NOAA Climate.gov image from University of Miami data.
Will this La Niña, already a sequel itself, end up part of a trilogy? Three La Niña winters in a row isn’t unprecedented—that happened in 1973–1976, and 1998–2001—but it is relatively unusual. We will have a better idea by the late spring about what may happen with ENSO in 2022–2023.
Getting back to our current event, there’s about a 2-in-3 chance that this La Niña will be at least moderate in strength, meaning the peak Oceanic Niño Index (the 3-month-average Niño-3.4 anomaly) will be greater than 1.0°C cooler than average. The stronger the ENSO event, the more predictable the weather and climate impacts. More info about how we forecast the strength of an El Niño or La Niña event here.
Post-credits scene
Regardless of the critical reception, ENSO will always be bringing the drama, and your trusty ENSO bloggers will be here to watch and report!
Comments
A note to readers: Comments are moderated
All blog comments are placed into moderation before they are published to the site. Comments must be on-topic, civil (free of profanity, name-calling, and insults or personal attacks), and must not spread false or misleading information. Play ball!
Nov 2021 La Nina
Thanks for the update on this year's La Nina. This stuff can sometimes make my head spin, but your clever, lighthearted treatment made it easier to digest. Especially since I had to scroll back a few times to be sure I understood.
When you stop and think…
When you stop and think about it, a whole 24 events in the period of record doesn't equate to a whole lot to bet the bank on. No wonder it's still so unpredictable to a large degree.
The limited record of…
The limited record of reliable observations is definitely a challenge we often struggle to grapple with, especially, as Michelle's recent post discusses, since the climate system can have large, unpredictable variations (internal variability) over many decades. This is one reason why it is critical to have accurate computer models that capture the physical processes of ENSO, so we do not have to rely on the observed record alone. These models are pretty remarkable, but of course, we are always striving to get more observed data and to make better models.
ENSO blog coverage
Splendid, as usual. You really make matters simple, even for a layman like me to understand. May I request you to add in your reports what impact events like these will have on the weather in other parts of the world, such as India or LATAM? That will be really helpful to us outside the U.S. and widen your audience as well. Keep up the good work!
Many thanks.
Thanks for your comment…
Thanks for your comment. Given that Climate.gov and the ENSO Blog support the mission of the U.S. National Oceanic and Atmospheric Administration, the blog will tend to have a U.S. focus. However, we do frequently discuss impacts that extend beyond the U.S. (see, for example, here, here, and here). We'll definitely keep an eye out around the globe for possible notable impacts of this La Nina.
La Nina
So far it's been nicely wet but fairly warm here in the inland northwest... hopefully we will start to get some Gulf of Alaska events as opposed to the pineapple express variety! 😬
👍👍
> “I haven’t yet seen the Walker circulation standing outside La Niña’s house holding a boombox aloft, but ENSO is always full of surprises.”
This is so good.
Thank you
Thank you very much for the updates . The model estimates for the monthly sea surface temperatures show that at least 40% of the models signal to stronger La-nina than a moderate one , at least three of the models appear to be outliers with extreme negative sea surface temperature estimates for the months November-January, should this signal a strong lanina rather a moderate one , especially the polar vortex this year had shown early winter behaviors in November particularly in lower latitudes . I would weigh the three extreme model estimates to have a significant negative effect on the deflection of sea-surface temperatures next month particularly most of the models show below -1 deflections ? This is an intuitive guess however that may have explanation. I had hoped the comment would allow figure attachment to make better illustration .
Above all, thank you again & wishing you and everyone else a happy and safe winter .
BR
Mohamed Alkhateeb
The Hashemite Kingdom of Jordan.
It's true that three of the…
It's true that three of the NMME models are indicating a stronger La Nina this autumn and winter - the disagreement among the NMME models is a bit striking considering the short lead times. However, I note that the NASA model has been biased cold for many months now, so I would discount that forecast. Also, the ocean analysis used to initialize the CFSv2 (GODAS) has been a bit colder than other initializations, and it may be due to missing TAO array data - the CPC Monthly Ocean Briefing has some discussion of this. The bottom line is that I am skeptical of the very cold forecasts, but I agree that these possibilities should not be dismissed outright.
Thank you
Thank you Nathaniel for the update and the information . I agree too that those three outlier models could bias the estimate toward negative deflection a nudge toward the negative, given the other low model/element estimates are also close-by the critical threshold of (=-1) . Praying everything will be for good of everyone .
warmest regards
Mohamed
La Nina 2021 -22 Australia Region
Interestingly the Australian Bureau of Meteorology uses slightly different criteria to define ENSO events and has not yet officially declared a La Nina.
I will be interested to see when and if they do. Certainly many of the characteristics of a La Nina event are already present across much of the continent so it could may be soon.
La Niña - Moderate Intensity could change?
Thank you for the updates, there are very helpful!
You mention the possibility of a 3rd La Niña phenomenon in a row, which could be very problematic for grains' production in US and LatAm. Knowing that is very important for me.
However, regarding the intensity of current La Niña (moderate), what is the probability of that intensity forecast to rise or drop? or in other words, what is the margin of error for that intensity to change in the following months? A final question is, which month prediction regarding the intensity of the phenomenon has the best score of an accurate prediction?
Thank you in advance for you help!
Best,
Edder
Hi Edder, I can imagine how…
Hi Edder, I can imagine how disruptive a 3rd La Nina in a row could be! Regarding the La Nina intensity, this webpage is a good resource for getting an idea about the likelihood of various intensity possibilities. For example, it currently shows a 14% probability of the Nino 3.4 SST anomaly being less than -1.5C from November through February, so that means a 14% probability of a strong La Nina. It's difficult to say how that will change in the coming months, but we can expect the uncertainty about the upcoming winter to diminish, which means the probabilities for a small number of bins will increase and the rest will decrease.
Regarding the accuracy of the predictions, I think this article is a good resource. Specifically, the bottom right panels in Figures 9 and 10 (two different metrics) give a concise summary. The main features are (1) forecasts targeting boreal fall and winter are rather accurate about 5-10 months in advance (depending on your error tolerance), and (2) forecasts targeting boreal spring and summer are much less accurate, due in large part to the spring predictability barrier.
Intensity
Hi Nathaniel, Aren't we still technically in a weak La Nina? I was told by a climate scientist elsewhere best not to put these events in a box (weak, moderate, strong) as the current overall SST setup is enhancing La Nina's effects.
current intensity
Hi Bob, yes, I would categorize the current intensity as weak, but I also would agree with your other point raised by another scientist. When looking at the current tropical rainfall anomalies and at the projected impacts on the hemispheric atmospheric circulation, I believe that the expected impacts may be on the moderate side even if the event remains weak based on tropical sea surface temperatures alone (but expected impacts aren't always actual impacts, as I wrote about last year). Overall, I would agree that decadal variations in the tropical sea surface temperatures may be helping La Ninas "punch above their weight," which may relate to a study I led a couple years ago.
Climate change effect on average
Can you point me to published research (or explain it here!) how climate models -- specifically that of the ENSO -- are incorporating climate change effects? For instance, are more recent changes to SST weighted in the average, and does this require adjusting of the temperature threshold of La Nina/El Nino? Thanks.
Climate models, ENSO, and climate change
Thanks for your question. Climate models do not incorporate any adjustments explicitly for ENSO in response to climate change, but rather the changes in ENSO emerge from the effects of greenhouse gas warming interacting with the physical laws encoded in the ocean and atmospheric models. In other words, climate models consist of equations that capture physical laws like conservation of energy and mass, and the various weather and climate phenomena like ENSO emerge as a result of the ability to simulate these basic physical processes in our climate system. Although the simulation of ENSO may be factored into the "tuning" of various parameterizations (parameterization is needed for processes that cannot be explicitly simulated by the climate model, mainly because grid cells are too large to simulate smaller-scale processes), climate models do not explicitly target the simulation of ENSO. It's actually reassuring that fairly realistic simulation of ENSO emerges without this explicit goal of simulating ENSO. This site provides a brief overview of climate modeling that may be helpful.
The effects of increasing greenhouse gases are incorporated into the radiative transfer components of our climate models, and the resulting temperature changes in the atmosphere and ocean affect all sorts of phenomena like ENSO through the interaction of these temperature changes with the physical laws and parameterizations encoded in our atmosphere and ocean models. Therefore, the changes to ENSO again emerge from the basic physics captured by these models, but there are no ad hoc adjustments specifically for ENSO.
We have published several blog posts related to ENSO and climate change. You can find them here, here, here, here, and here. I hope that helps!
"Better Off Dead" reference
"I haven’t yet seen the Walker circulation standing outside La Niña’s house holding a boombox aloft"
That's hilarious! Great reference to an awesome movie!
SSTs differential at record levels NE Pacific
Thank for your informative article.
NE Pacific could be a prime area for cyclogenesis this coming Winter:
--Note: link removed. Our comment policy prohibits the posting of links that could be perceived as marketing a commercial product or service. --Rebecca
In a Nutshell
Thank you for your article, I appreciate your use of wit to help swallow the medicine;) In a nutshell, please let me know if I correctly picked up what you were putting down..
1. Models still indicating high percent chance of a moderately strong La Nina event.
2. La Nina event for US means wetter to the North, drier to the south.
3. La Nina precipitation event also typically brings colder temperatures to the North, warmer to the South.
4. For this winter/spring, you are leaning away from the possibility of the colder temperature narrative.
Thanks again,
Kelley
nutshell
Hi Kelley, that's a pretty good summary. I would just add the caveat that the impacts of La Nina are always in terms of probabilities; Mother Nature sometimes can have other ideas, like what we saw last winter. Regarding the colder solution for winter/spring, I will point out the peak of La Nina typically occurs around now (late November), so it's hard to imagine that we will suddenly turn much colder in December and January like some models indicate. However, that is my personal opinion and not an official NOAA position. :-)
Great
"I haven’t yet seen the Walker circulation standing outside La Niña’s house holding a boombox aloft"
That's hilarious! Great reference to an awesome movie!
Best Regards: KahootGuide
the period of record does not equate to a whole lot to bet the n
When you stop and think about it, a whole 24 events in the period of record does not equate to a whole lot to bet on. No wonder it's still so unpredictable to a large degree. Splendid, as usual. You really make matters simple, even for a layman like me to understand.
Comments have been disabled on this article