December 2016 ENSO Update: Weeble wobbles
La Niña’s clinging on by her fingernails! If last year’s big El Niño was likened by some (not us) to a certain monster lizard, this La Niña is more like a gecko. Weak La Niña conditions were present during November, and are favored to continue through the mid-winter. It’s looking more likely that the tropical Pacific will transition to neutral conditions by the January – March period.
The temperature of the ocean surface in the Niño3.4 region in the east-central tropical Pacific was about 0.9°C below average during November using the ERSSTv4 data set, and the September – November period was about 0.8°C below average. This is the third three-month period in a row below the La Niña threshold of -0.5°C—this has to last for at least five consecutive three-month periods in order to qualify as a La Niña event by this indicator. Forecasters think we’ll just barely make it.
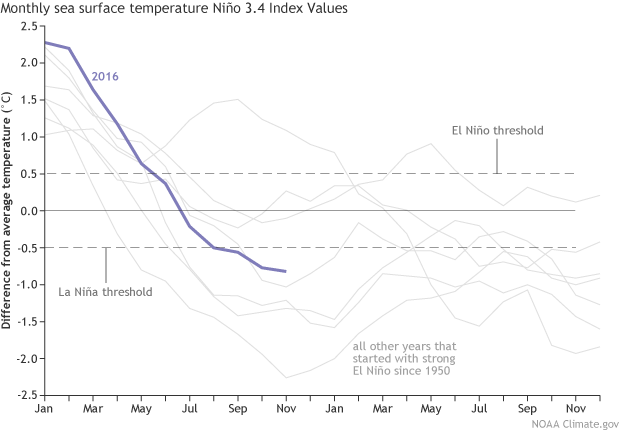
Monthly sea surface temperature in the Niño 3.4 region of the tropical Pacific compared to the long-term average for all years starting off from moderate-to-strong El Niño since 1950, showing how 2016 (blue line) compares to other events. Climate.gov graph based on ERSSTv4 temperature data.
The atmospheric conditions that we expect with La Niña—stronger-than-average winds, both near the surface and high up in the atmosphere, and more clouds and rain over Indonesia with less over the central and eastern Pacific—have persisted over the past couple of months, although they aren’t particularly impressive. The atmospheric changes are a response to the changes in sea surface temperature, and also act to reinforce them.
The forest and the trees
Over the past few years, we’ve spent some column inches on “seasonal” versus “subseasonal” climate phenomena. El Niño and La Niña are seasonal, meaning when you average over a period of several months, the signs we look for in the tropical Pacific are consistent. If the overall pattern doesn’t persist for several months, it’s not La Niña.
There is always going to be some variation within a season—even a warmer-than-average winter will have some cold snaps mixed in. Overall, November showed La Niña conditions were present. However, there was also some subseasonal activity in the tropics that interfered with the La Niña signals. The Madden-Julian Oscillation, or MJO, is essentially an area of storminess that travels from west to east along the Equator. It’s not always active, but it was during November, with the area of clouds and rain moving through Indonesia and the central Pacific.
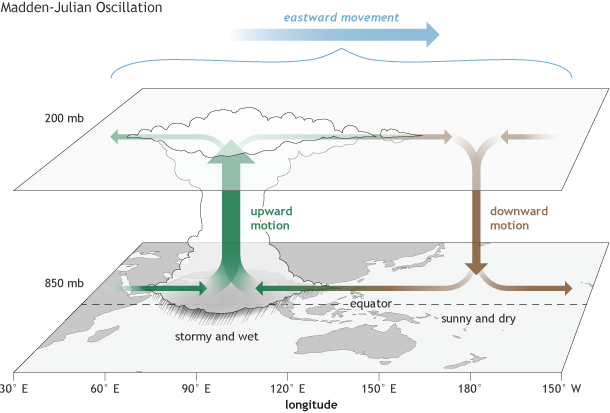
The surface and upper-atmosphere structure of the MJO for a period when the enhanced convective phase (thunderstorm cloud) is centered across the Indian Ocean and the suppressed convective phase is centered over the west-central Pacific Ocean. Horizontal arrows pointing left represent wind departures from average that are easterly, and arrows pointing right represent wind departures from average that are westerly. The entire system shifts eastward over time, eventually circling the globe and returning to its point of origin. Climate.gov drawing by Fiona Martin.
When this area of clouds, rain, and storms moves through Indonesia and the tropical Pacific, it can enhance or reduce the La Niña patterns. (All this applies to El Niño, too, but I’m going to dance with the one that brought me.) The area of storms is flanked by drier-than-average spots ahead and behind it.
At the beginning of November, the pattern of cloudiness over the tropical Pacific looked clearly like La Niña conditions, with more cloudiness than average over Indonesia (responding to warmer ocean waters there) and less over the central Pacific (as La Niña’s cooler waters led to less rising air.)
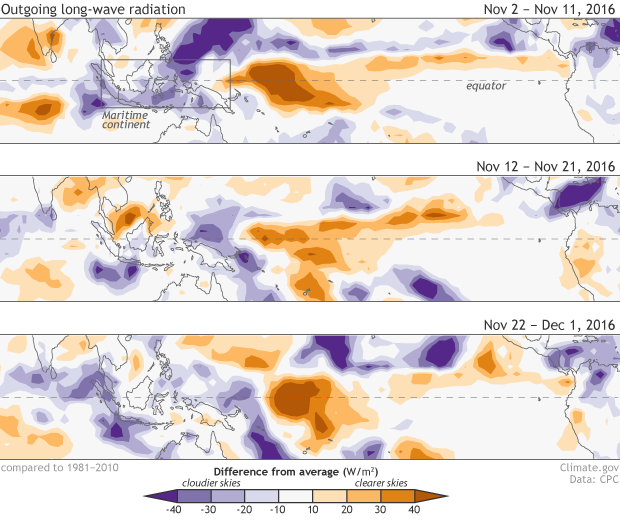
Places that were more (purple) or less (orange) cloudy than the 1981-2010 average during early, mid, and late November 2016, based on satellite observations of outgoing longwave radiation (heat). Thick clouds block heat from radiating out to space, so less radiation = more clouds, and more radiation = clearer skies. Climate.gov map from CPC data.
In mid-November, though, the pattern is weaker, as you can see in the middle panel above. It’s still there, but since the MJO was moving through the central Pacific, it interfered with La Niña’s patterns. Specifically, the stormy area of the MJO weakened the drier area associated with La Niña in the central Pacific. Also, the drier area trailing the MJO reduced the rain over Indonesia.
The MJO can circle the globe in 1-2 months, and especially speeds through the Western hemisphere. By late November, the stormy area was back in the Indian Ocean. The drier area ahead of the MJO was weakening the La Niña-associated rain over Indonesia. Since the MJO was far away, the La Niña dry area in the middle of the Pacific had reasserted itself. As of early December, the MJO has gone to sleep, and the forecast for MJO through December is uncertain. If you’d like to read about the current MJO status in detail, check here.
The animals and the zoo
That area of storms has a wind signature, too, as the rising air causes low-level winds to rush in toward the storms. Changes in the near-surface winds can lead to changes in the ocean temperatures, both through cooling or warming the surface and by kicking off Kelvin waves—areas of cooler or warmer subsurface waters that travel eastward under the surface of the Pacific over a few months.
My point here is that the effect of subseasonal systems like the MJO can last beyond the immediate impact. It’s too soon to tell if this MJO has had a longer-lasting effect, but we’ll certainly keep our weather eye on the tropical Pacific for the next few months. (We would do it anyway, because that’s our job!)
The kangaroos and the outback?
If you’re a real ENSO enthusiast, you may have noticed the Bureau of Meteorology, our counterpart in Australia, has updated their forecast, saying that they do not think that La Niña conditions are present, and are unlikely to develop in the coming months. This isn’t as contradictory to what we’re saying as it sounds. Mostly, it’s a good indication of how puny the La Niña conditions are. The Bureau of Meteorology uses a different threshold, requiring the Nino3.4 Index to be cooler than 0.8°C below average (our threshold is 0.5°C below average). Neither threshold is wrong or right, and we’re looking at the same weak atmospheric conditions.
The weak La Niña is just one player in the US winter forecast. Check out CPC’s long-range predictions for the outlooks over the next several months.
Comments
Comments have been disabled on this article