December 2017 La Niña update: Double, double
Our second La Niña year in a row is in full swing now, and is forecast to last through the winter. In November, the average surface water temperature in the Niño3.4 region of the central Pacific Ocean was about 1.0°C cooler than the long-term average. A “double-dip” La Niña is not uncommon—seven La Niña winters in the 1950-present historical record followed La Niña the previous winter: 1955, 1971, 1974, 1984, 1999, 2008, and 2011. In fact, two years, 1975 and 2000, were third-year La Niñas. Only four years, 1964, 1988, 1995, and 2005, were single-year La Niñas.
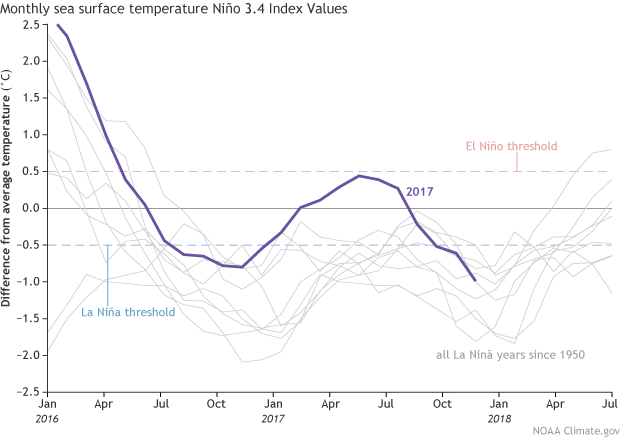
Monthly sea surface temperature in the Niño 3.4 region of the tropical Pacific compared to the long-term average for all multi-year La Niñas since 1950, showing how 2016-17 (blue line) compares to other events. Multi-year La Niña events are defined as at least 2 years in a row where the La Niña criteria are met. Both continuous events, when the Oceanic Niño Index remained below -0.5°C, and years when the ONI warmed mid-year before again cooling, are included here. For three-year events, both years 1-2 and 2-3 are shown. Climate.gov graph based on ERSSTv5 temperature data.
This graph illustrates something interesting about our current La Niña. During multi-year La Niñas, the surface temperature in the Niño3.4 region often moves closer to average after the first winter, before cooling again to get back into La Niña territory for the second winter. However, this is the first time on record the surface temperature has been warmer than average for a period before returning to La Niña conditions.
Eye of newt and toe of frog
Also, there are continuing signs that the atmosphere is responding to the cooler-than-average surface waters with a strengthened Walker Circulation. Evidence of the atmospheric response is provided by fewer clouds and less rain over the central Pacific and more rainfall than average over Indonesia. Stronger-than-average near-surface trade winds (the east-to-west winds along the equator) and upper-level winds were also observed during November.
Speaking of the atmospheric response… as we’ve discussed many times before in this space, ENSO (El Niño/Southern Oscillation) is a coupled ocean-atmosphere system. Meaning, the changes in the ocean affect the atmospheric circulation, and the atmospheric circulation affects the ocean, in a feedback loop. In the case of La Niña, the cooler-than-average waters in the central and eastern Pacific lead to stronger east-to-west surface winds. Those winds in turn help to cool the surface further and to keep warmer water trapped farther to the west, in the region of Indonesia. This is why ENSO is a system (a charm of power and trouble?) and not just a bunch of odds-and-ends (wool of bat and tongue of dog?).
One nice way to visualize the strength of the feedback between the ocean and the atmosphere is to analyze the relationship between the ocean surface warming/cooling and the changes in wind stress. The wind stress is essentially the force that the wind exerts on the ocean surface. When wind blows over water, it drags on the water. The amount of wind stress is a combination of the speed of the wind, the height of the ocean surface waves, and the air density.
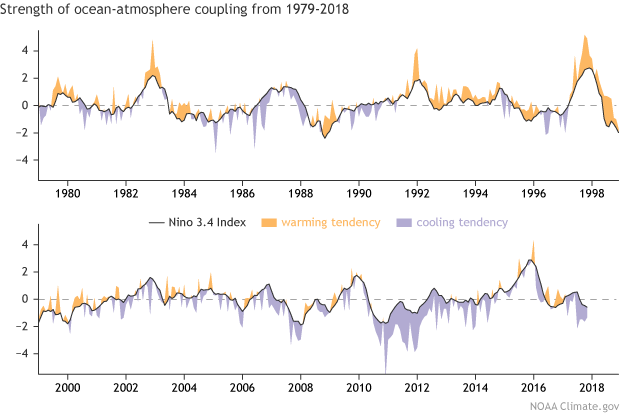
Sea surface temperature anomaly (departure from long-term average) observed in the Nino3.4 region (black line). Shading shows sea surface temperature anomaly tendency due to wind stress. Red indicates times when the wind stress tends to enhance surface warming; green shows where the wind stress tends to enhance cooling. Climate.gov figure based on data from CPC’s Zeng-Zhen Hu.
During La Niña, the wind stress is usually stronger than average, mostly due to the faster near-surface winds. If the wind stress is stronger, the ocean-atmosphere coupling is also stronger, leading to more cooling of the ocean surface. Recently, the wind stress has been reinforcing the cooler central and eastern Pacific surface, telling us that La Niña conditions are solidly in place.
Toil and trouble?
La Niña is expected to affect global weather patterns this winter. As I mentioned above, the stronger Walker Circulation means there is more convection (rising air, clouds, and storms) over Indonesia and the far western Pacific, and even less than average over the central Pacific.
In addition, warm air that rises along the equator travels toward the poles and descends in the mid-latitudes, in a pattern called the Hadley Circulation; the descending air fuels the subtropical jet stream. During La Niña, with more convection in the far west Pacific and less in the central Pacific, the subtropical jet stream is retracted to the west. The retracted jet means fewer storms reach the west coast of the United States, tending to leave the southern tier of the country warm and dry. For more details on how La Niña affects the circulation, check out Tom’s great post.
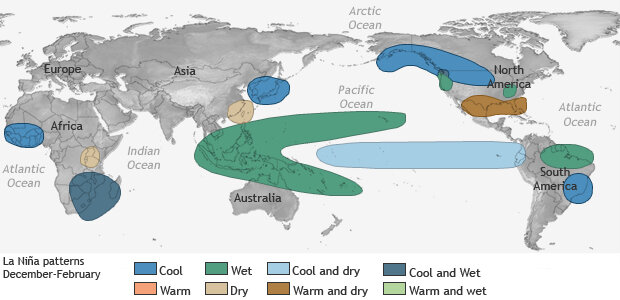
Typical impacts of La Niña during winter in the Northern Hemisphere. NOAA Climate.gov map.
The La Niña tendency toward warmer and drier along the U.S. southern tier is reflected in the Climate Prediction Center’s seasonal outlook for this winter. The outlooks will be updated on December 21st for the January–March period.
Of course, on this blog we’re constantly emphasizing that one month does not a season make. However! It’s interesting to note that this past month’s precipitation and temperature averages over North America resemble the expected La Niña winter pattern.
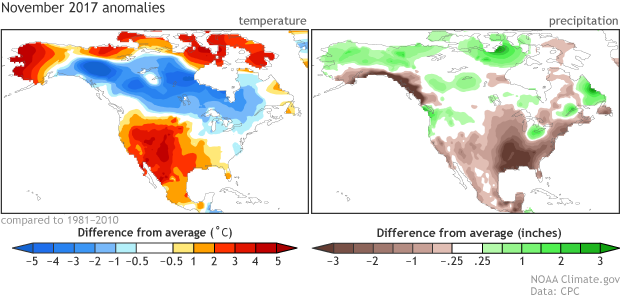
November 2017 temperature (left) and precipitation (right) anomalies for North America. Anomalies are difference from the long-term (1981-2010) average. Climate.gov figure from CPC data.
There’s no guarantee that this is giving us a preview of winter; attributing rain and temperature effects to climate patterns is no easy task, and November’s not winter anyway. That said, La Niña’s witch’s brew is likely to affect our winter, potentially continuing the warmer and drier conditions we saw during November.
Thanks to Zeng-Zhen Hu for his help with this post!
Comments
A very comprehensive view of
Fascinated by patterns
Warming/Cooling Data
RE: Warming/Cooling Data
Good question. From Zeng-Zhen Hu:
Hi Sam,
Here are the steps I used:
(a) Calculate the regressions of zonal wind stress anomalies onto the Niño3 index (1981-2010);
(b) Project observed wind stress in Nino3.4/Nino4 regions onto the regression pattern;
(c) Compared the observed SSTA and projected SSTA in Nino3.4/Nino4 regions to check the coupling strength.
Here is the reference:
Lloyd, J., E. Guilyardi, H. Weller, and J. Slingo, 2009: The role of atmosphere feedbacks during ENSO in the CMIP3 models. Atmos. Sci. Lett., 10: 170–176.
warm?
RE: warm?
I like how Deke phrased it on the Beyond the Data blog.
"I like to think of long-term change, the kind that has been going on since the early-to-mid 20th century, as riding up an escalator. Transitory bumps from factors like El Nino, are like jumping up and down while you’re on the escalator. "
https://www.climate.gov/news-features/blogs/beyond-data/beyond-2016-year-review
Here's another nice graphic showing ENSO superimposed on global surface temperature data:
https://www.climate.gov/news-features/blogs/beyond-data/how-will-el-niño-affect-2015’s-placement-among-warmest-years-record
So, La Nina may help contribute to a small downtick in GMST, but you're right that we're very globally very warm despite having a La Nina.
I don't see a way to subscribe
RE: I don't see a way to subscribe
Thanks for your interest in the blog! I receive climate.gov articles through my RSS feed ( feed:https://www.climate.gov/news-features/feed.xml ) and climate.gov tweets out new blog articles as they are posted (@NOAAClimate). Finally, NOAA climate.gov is on Facebook as well!
La Nina
great post !
La Nina
RE: La Nina
Hi Hubi,
La Nina is here! Which means that both the ocean and atmosphere are reflecting La Nina conditions. Check out here for the latest updates.
Comments have been disabled on this article