What’s the hold up, El Niño?
In the July 10 update and ENSO discussion, we said the atmospheric part of ENSO doesn’t seem to be responding to the ocean. El Niño requires that both be in sync and coupled with each other. Why is the atmosphere acting aloof to the rather warm ocean? This development may be especially surprising to folks given the rumors and speculation of a very strong El Niño that followed March’s oceanic Kelvin wave.
In June, the Bureau of Meteorology in Australia made an interesting observation that might shed light on the lack of coupling between the ocean and atmosphere (1). They pointed out that an anomalous sea surface temperature (SST) gradient was not in place across the equatorial Pacific Ocean. Like the gradient of a hill on a highway, an SST gradient describes a change in temperature across the ocean surface from one location to another (2).
The maps below show the typical evolution of SST anomalies leading up to wintertime El Niño events (winter is when ENSO is strongest). In this post, the SST gradient will refer to the difference in SST anomalies. “Anomalies” are the departures from the average state of the atmosphere or ocean. Blue shading shows where SSTs are below average, and red shading shows where SSTs are above average. In this case, the gradient refers to the more negative (cooler) SST anomalies in the western Pacific (blue shading) and the more positive (warmer) SST anomalies in the eastern Pacific (red shading).
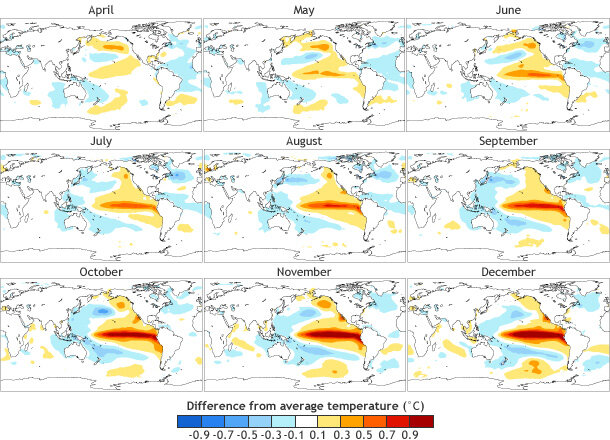
The typical evolution of sea surface temperature (SST) anomalies from April through December associated with El Niño. These maps were created using lagged regression onto the wintertime Niño-3.4 index using monthly data from ERSSTv3b from 1980-2012. The SST gradient is shown by the difference in near-to-below-average SST (white or blue) across the far western tropical Pacific and Indonesia and the above-average SST (red) across the central and eastern Pacific. Map by Michelle L'Heureux, Climate Prediction Center.
So who cares whether “SST gradients” in the equatorial Pacific are in place? Well, as it turns out, the atmospheric circulation often responds to these SST gradients, and if they do not exist then it is possible that the growth of El Niño will be less energetic or reduced—like a car that will coast downhill (big gradient) on its own but not across a flat stretch of road (no gradient).
A stronger SST gradient produces stronger winds (3) blowing across the equatorial Pacific. A weaker gradient results in weaker winds. This concept can also work in reverse: stronger winds can lead to stronger SST gradients and weaker winds contribute to weaker SST gradients (4).
Normally, the SST gradient associated with ENSO becomes stronger as the winter approaches. The figure above shows the growth of the ENSO-related gradient between the western and eastern SST anomalies for the months of April through December. In April, May, and June, the gradient is typically not very strong, though there is still a difference between the warmer SSTs in the eastern Pacific and the near average SSTs in the western Pacific (near average SSTs shown by the light colors or white regions).
This year however, the SST gradient is weak- to- nonexistent, as shown by above-average SSTs in both the western and eastern equatorial Pacific Ocean.
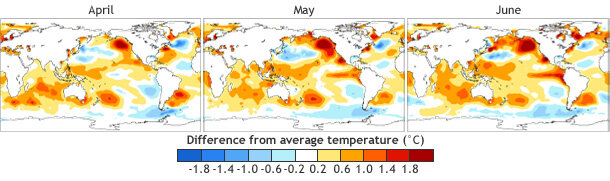
Recent sea surface temperature (SST) anomalies (or departure from average) in April, May, and June 2014. Unlike the typical El Niño progression, both eastern and far western tropical Pacific SSTs have been above average (warmer). Map by Michelle L'Heureux, Climate Prediction Center. Data from ERSSTv3b (NOAA NCDC) using a 1981-2010 base period.
Because of these coupled feedbacks (e.g. winds can both cause and be caused by the SST gradient), it is difficult for ENSO forecasters to determine whether the ocean is pushing the atmosphere or the atmosphere is pushing the ocean. Think of it as a chicken-and-egg problem. The March 2014 oceanic Kelvin wave resulted in positive (warm) SST anomalies in the eastern Pacific. Normally, those conditions would trigger changes in the winds, pressure, and rainfall.
However, near Indonesia and the western Pacific, SSTs have been above average, which is not typical during El Niño development. It is possible that, in order for the atmosphere to better sync up with the ocean and for this El Niño to emerge and grow, the SST anomalies in the western Pacific and Indonesia will need to become near-to-below average, strengthening the SST gradient (5). Forecasters will be watching closely for evidence of this change going forward.
Footnotes:
(1) In their June 3rd 2014 ENSO wrap-up the Australians wrote “above-average sea surface temperatures (SSTs) also extend into the western tropical Pacific, meaning strong west to east gradients in tropical Pacific SST anomalies are yet to become established.” Their current ENSO discussions are available here. We, of course, prefer you look our CPC/IRI ENSO discussion, but we rather enjoy and appreciate the Australian perspective on ENSO.
(2) Gradients can exist in any direction. Here we are referring to the “zonal” or east-west SST gradient, but one could also look at the “meridional” or north-south SST gradient.
(3) If SST anomalies are being compared (as is the case in this post), then the stronger and weaker winds refer to the anomalous winds.
(4) This example is referred to as the “Bjerknes feedback” and is a positive feedback that helps to grow ENSO events. “Positive” feedback processes amplify the initial change (i.e. stronger SST gradients --> stronger winds --> stronger SST gradients), whereas “negative” feedbacks will act to dampen/counteract the initial change.
(5) This is a working hypothesis and requires more rigorous research and attribution.
References:
Bjerknes, J., 1969: Atmospheric Teleconnections from the Equatorial Pacific. Mon. Wea. Rev., 97, 163–172.
Comments
SST in the south
RE: SST in the south
Over the last 60 years one of the most significant SST trends has been positive trends (warming) over Indonesia/western Pacific. At this point, it's somewhat speculative to mention a link between these SST trends and what we are seeing *this year*, but it is certainly worthwhile to do some research on it .
That's a great discussion -
RE: That's a great discussion -
Nice to hear that from the Australian Bureau of Meteorology. Thanks
RE: RE: That's a great discussion -
new paradigm
El Niño
RE: El Niño
The current probabilities are provided in our monthly ENSO update:
http://www.cpc.ncep.noaa.gov/products/analysis_monitoring/enso_advisory…
... and are also displayed here:
http://iri.columbia.edu/our-expertise/climate/forecasts/enso/current/?e…
El Nino
RE: El Nino
pdo
RE: pdo
It is difficult for us to untangle how much decadal variability impacts ENSO from month-to-month, so it is hard to say either way. Also, when monthly Pacific Decadal Oscillation Indices are calculated, we find that much of that variability is due to ENSO. In other words, on shorter timescales, it likely that much of what you see in the North Pacific SST pattern is caused by ENSO (not the other way around).
We hope to have a future blog post on this topic in the coming months, so stay tuned.
The title of the colorbar in the 1st figure is wrong
RE: The title of the colorbar in the 1st figure is wrong
You're technically correct. The label should state degrees C *per standardized Nino-3.4 index value."
The rapid cooling of the ocean
Comments have been disabled on this article