How will El Niño affect 2015’s placement among the warmest years on record?
Earlier this spring, our (older) sister blog announced that El Niño is here. That has significant ramifications for parts of the world, because El Niño changes their odds of certain seasonal outcomes (wet, dry, warm, cool), especially if it maintains its strength, or strengthens further, and if it persists beyond our summer. That’s all detailed over at The ENSO Blog.
But why are climate scorekeepers like me interested in El Niño? Well, beyond the immediate influences on regional outcomes, it turns out that El Niño can push the needle on global temperature as well. The arrival of El Niño raises the chances of setting a new record-warmest global temperature for any time period. Just in 2015 alone, we’ve already broken or tied the record for the warmest 12-month stretches on record – four times. More specifically, because 2015 started very warm, and everybody loves to rank things by calendar year (guilty as charged, myself!), we start wondering how this El Niño episode will affect 2015’s chances to supplant 2014 as the warmest year in our records. To address these questions, let’s go Beyond the Data.
Check out the graphic just below. The bars show global temperatures over the last 30+ years, month by month, from the early 1980s on the left to April 2015 on the right. The higher the bar, the warmer the global temperature for that month.
Monthly temperature from 1982-April 2015 compared to the 1901-2000 average, with El Niño-flavored months in red, La Niña-flavored months in blue, and neutral months in gray. Graphic by Deke Arndt and Climate.gov, based on global surface temperature data from the National Centers for Environmental Information and monthly OISST sea surface temperature anomalies in the Niño3.4 region of the tropical Pacific provided by the Climate Prediction Center.
A few things pop out immediately. First, the overall trend is up - in general, the bars for recent months are taller than earlier months. Second, the trend isn’t smooth. There are wiggles and dips and spikes, some just a month or two long, some lasting a few seasons.
Now let’s look at those colors, which represent the warm, cool, and neutral “phases” of the oceanic part of the El Niño–Southern Oscillation pattern, known as “ENSO” for short. ENSO has oceanic and atmospheric pieces, but one simple stand-in for the big picture is sea surface temperatures in the central tropical Pacific Ocean. On the chart, red indicates months when these temperatures were warm enough to “qualify” for El Niño.
Without double-checking that there was also an atmospheric response, we can’t call these periods “El Niño episodes” for sure, so let’s call them “El Niño-flavored” instead. The red bars tend to be taller (warmer) than their neighbors – in other words, during El Niño-flavored months, the whole globe’s temperature tends to go up. Second, months tend to get warmer as El Niño-flavored conditions persist. The opposite generally holds true for La Niña months, shown in blue. As the opposite phase of El Niño, global temperatures during La Niña-flavored months tend to be cooler than their neighbors, and they tend to cool off further as La Niña-flavored conditions persist.
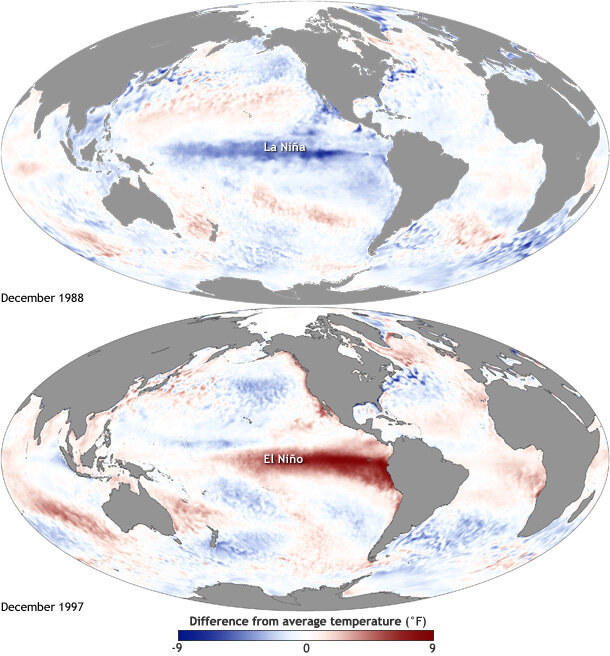
Maps of sea surface temperature anomaly in the Pacific Ocean during a strong La Niña (top, December 1988) and El Niño (bottom, December 1997). Maps by NOAA Climate.gov, based on data provided by NOAA View. large versions La Niña | El Niño
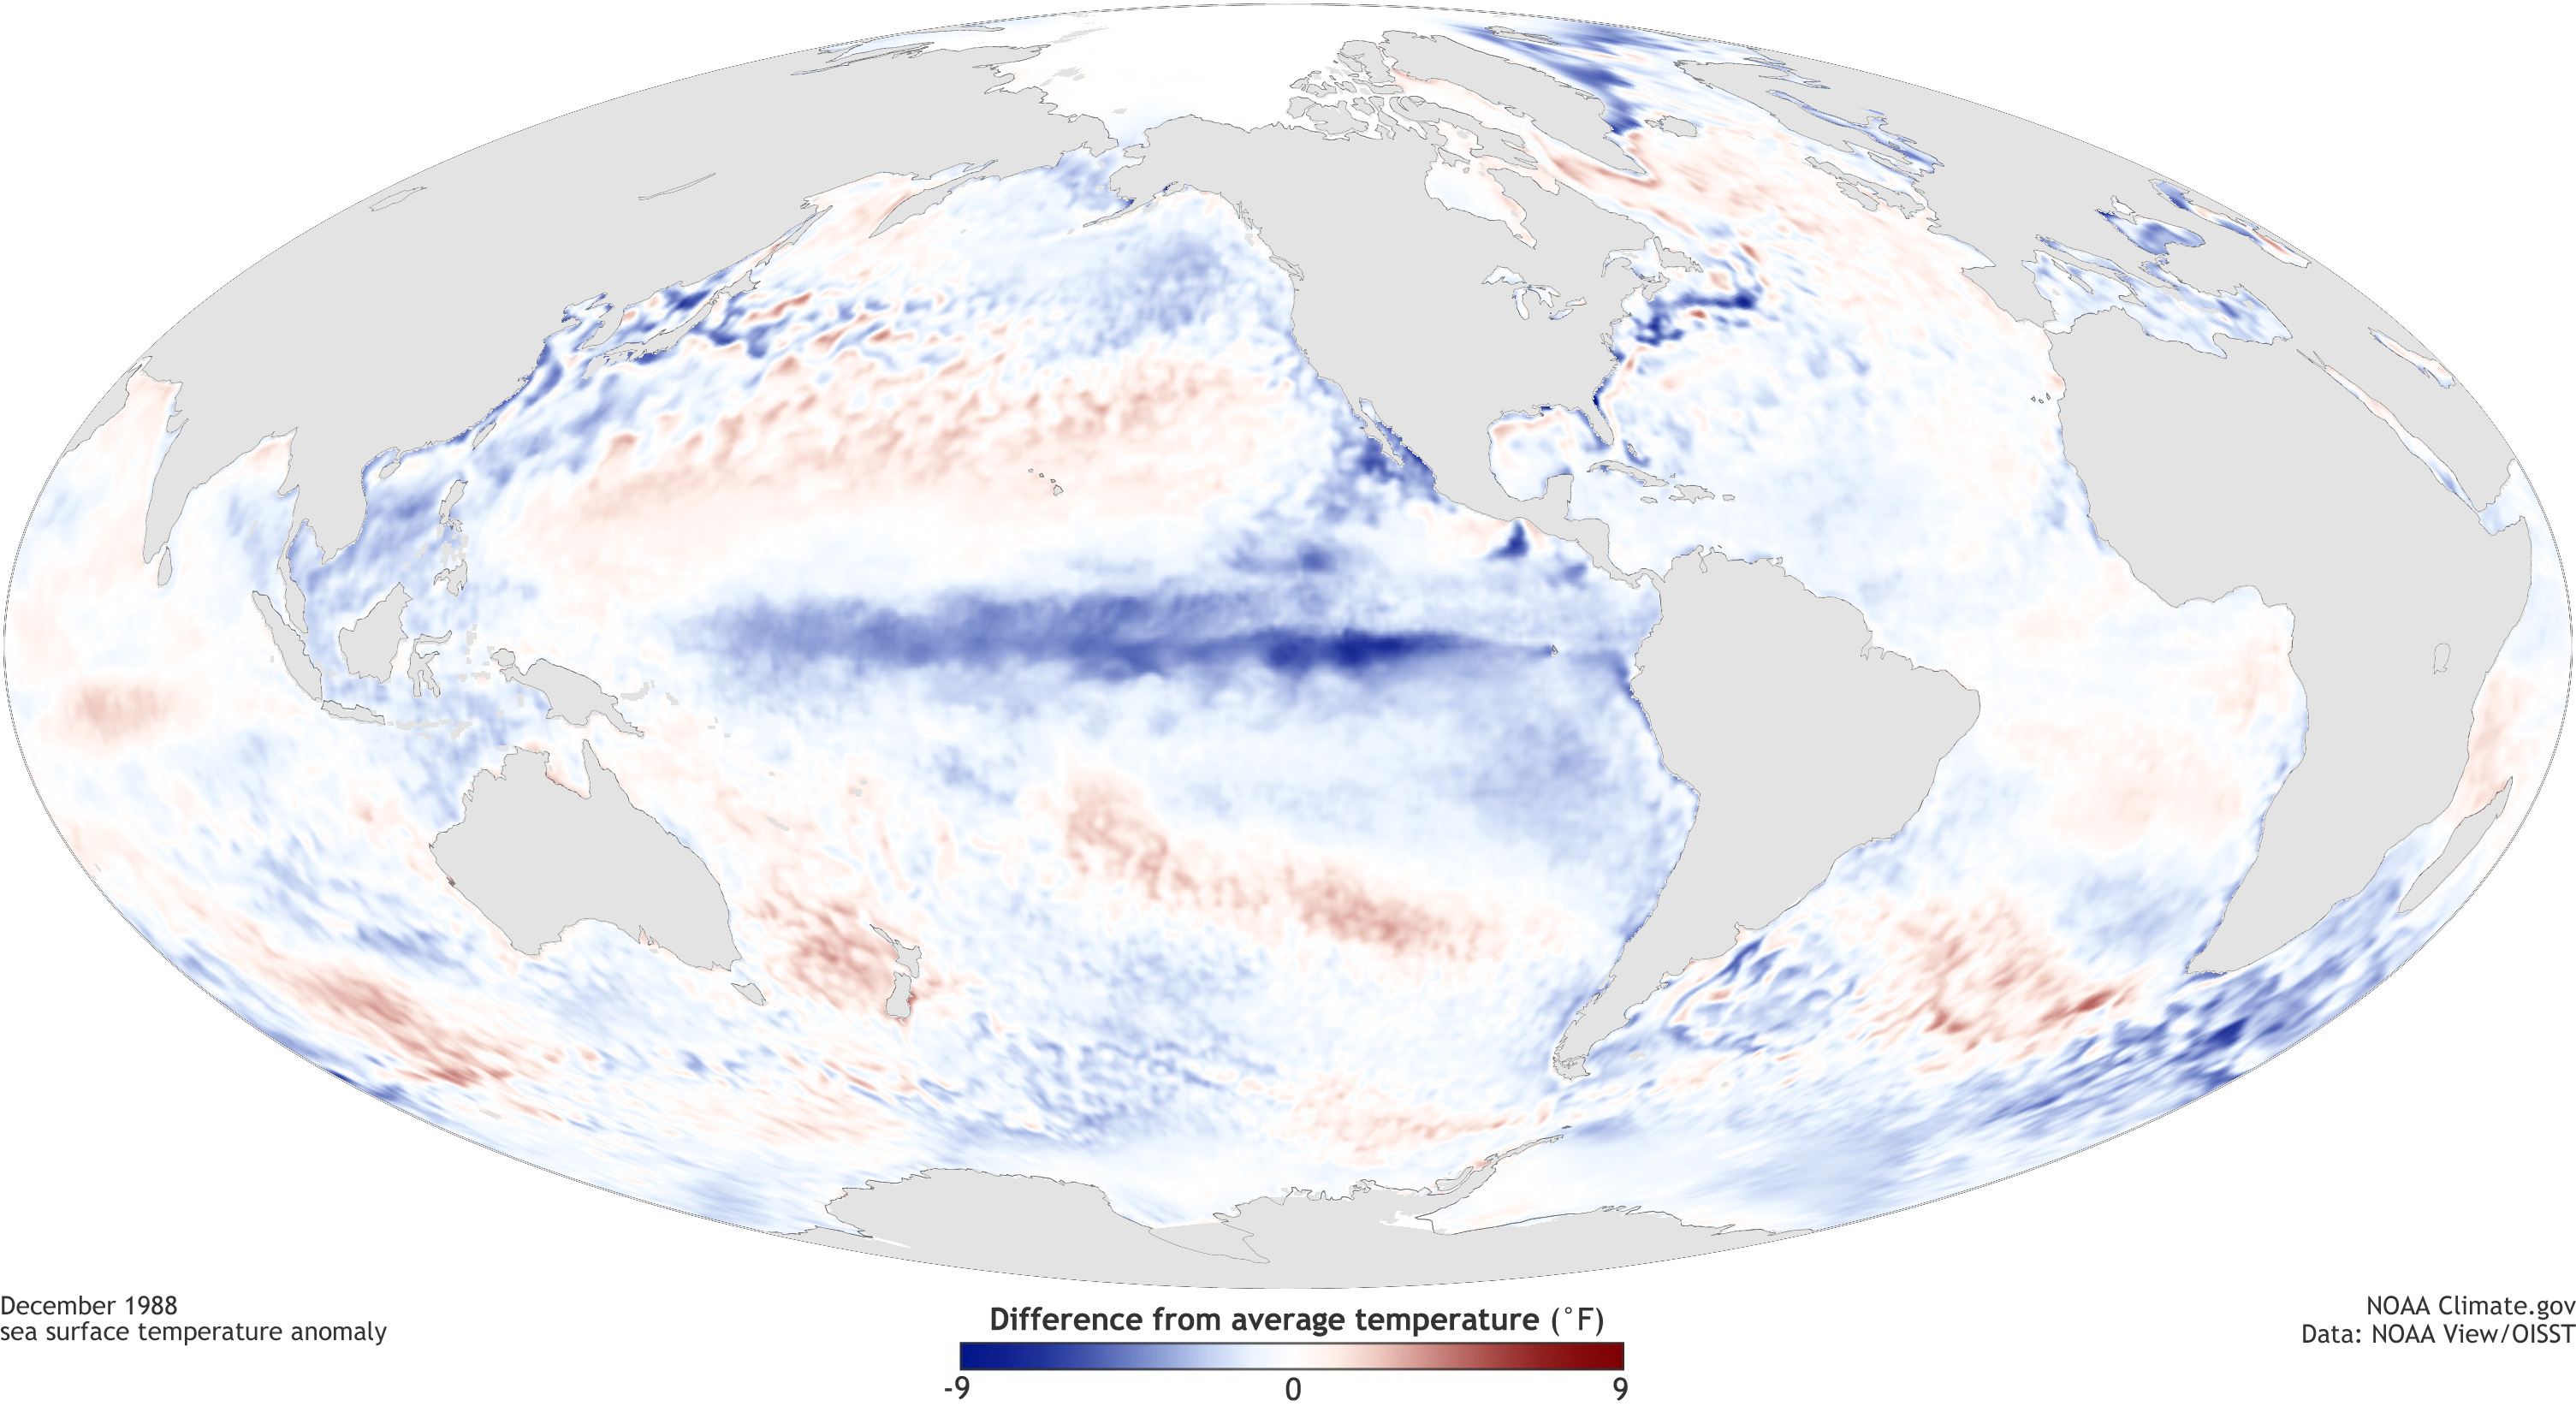
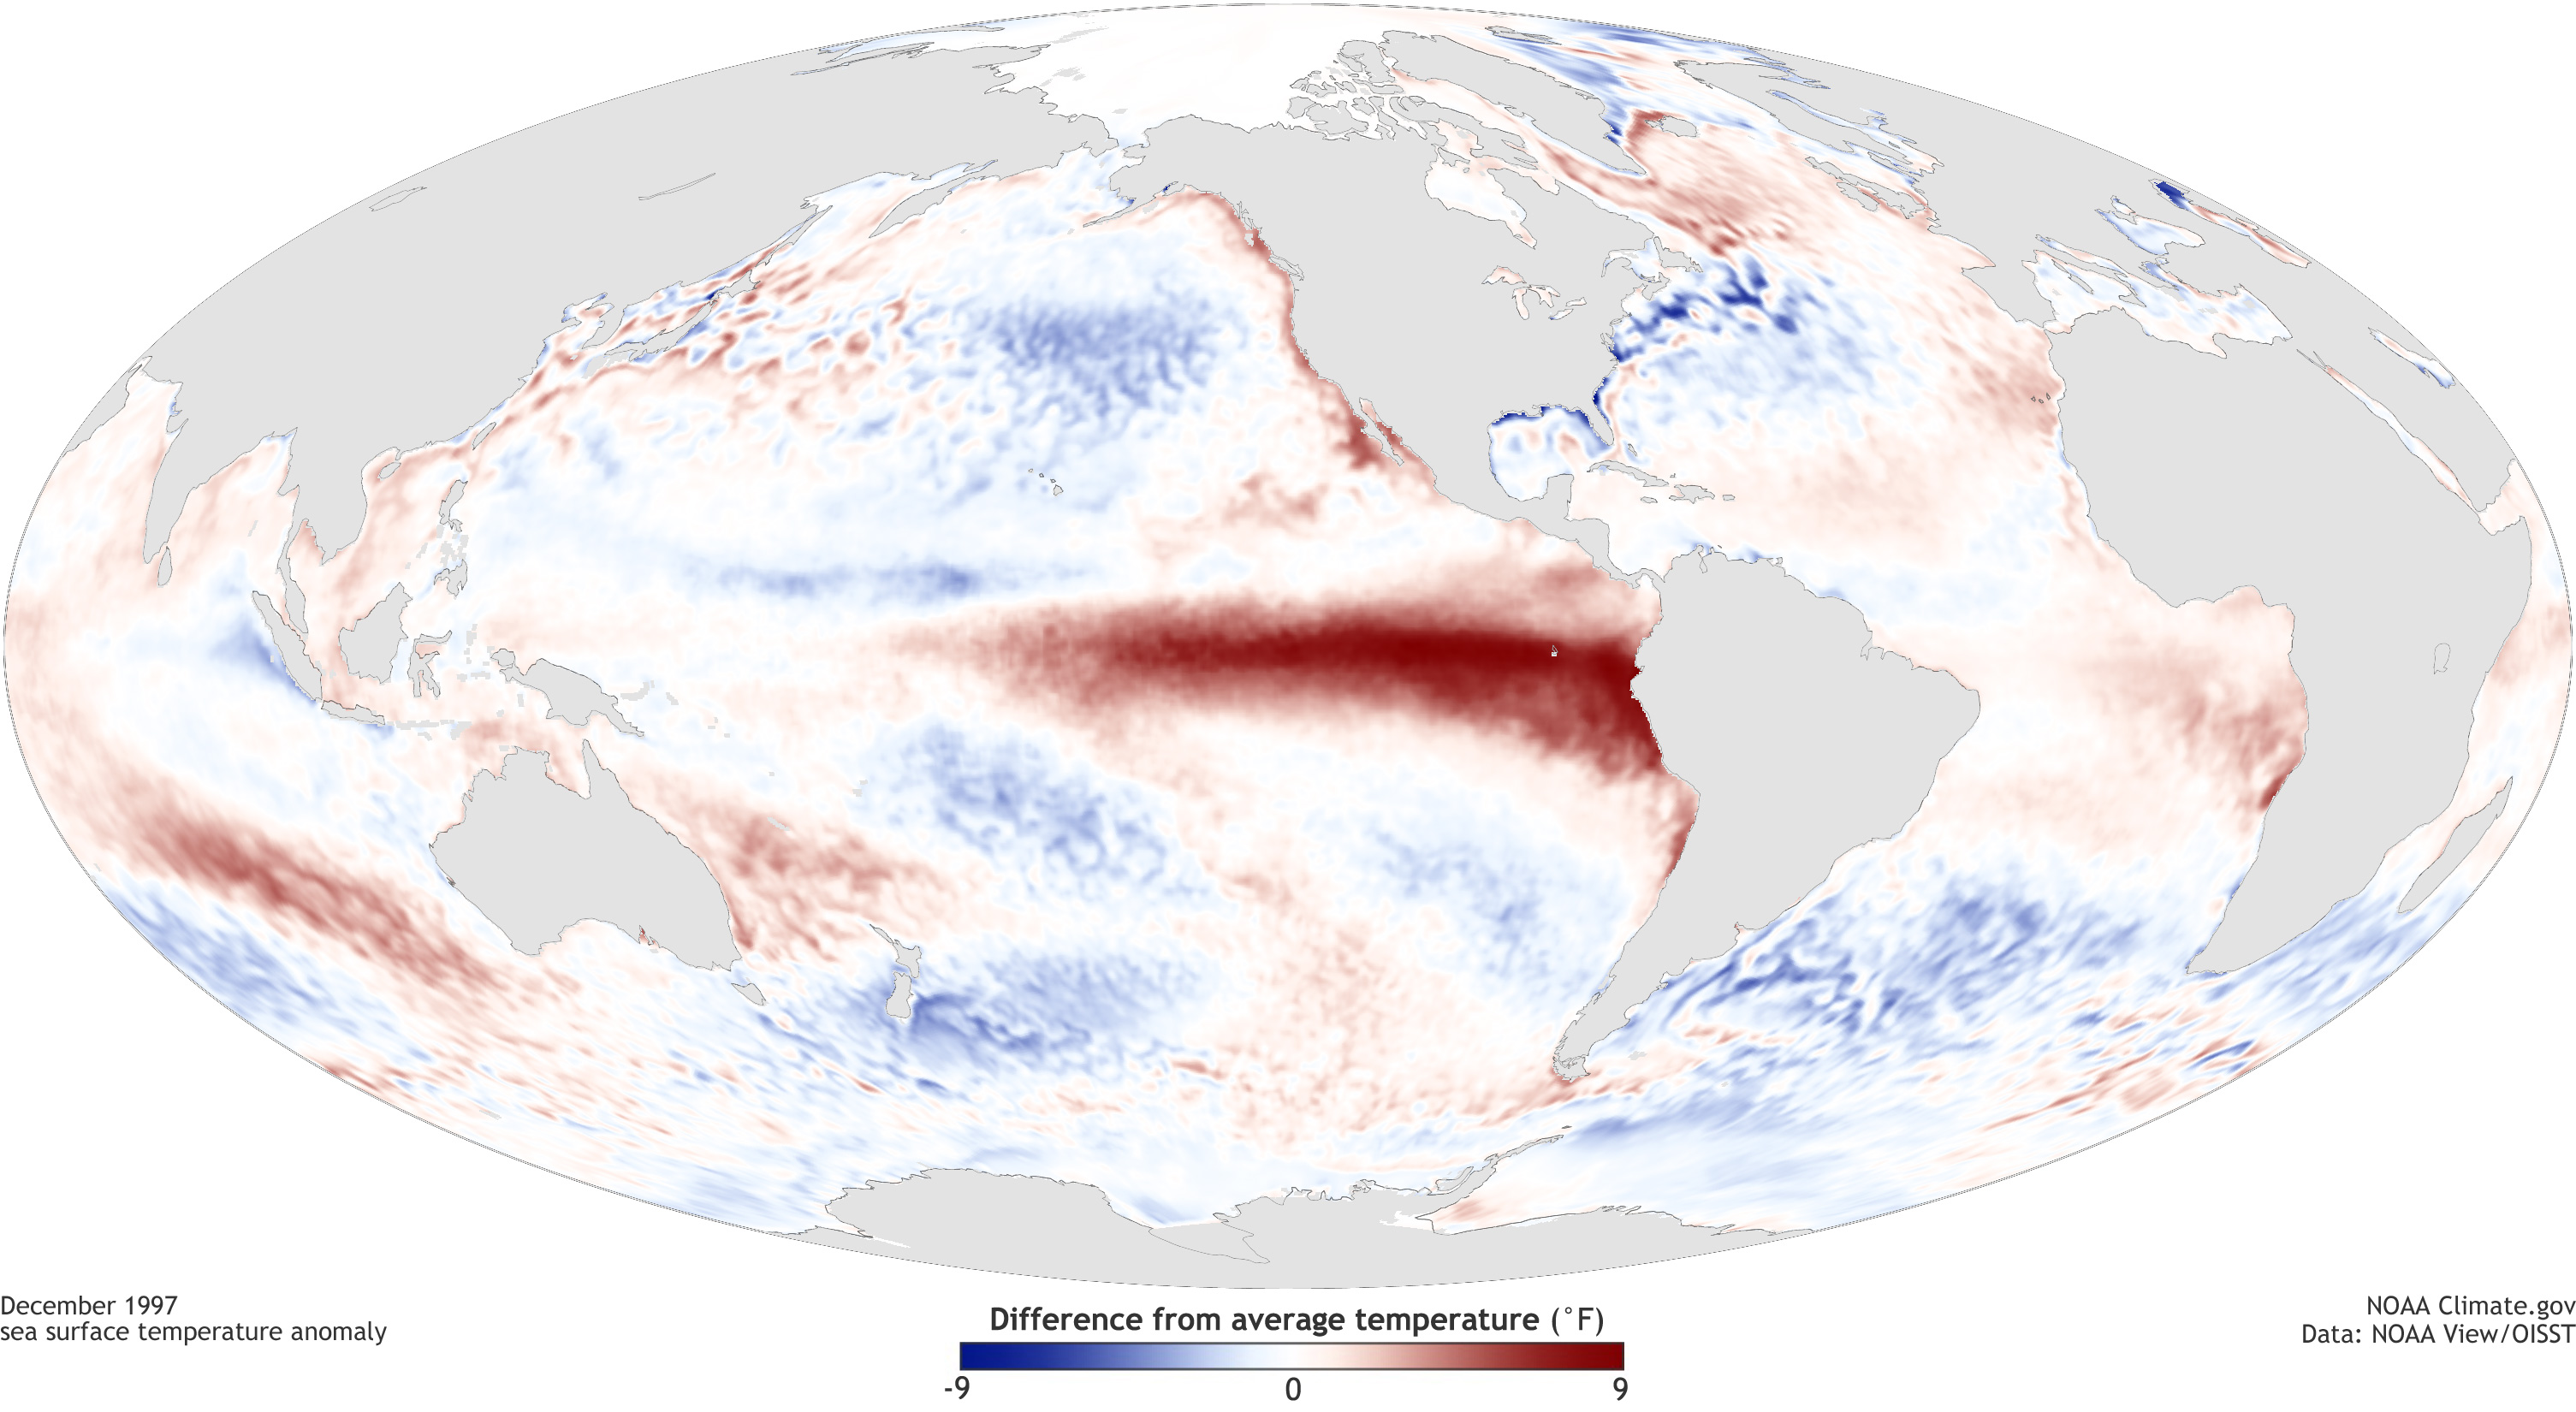
How does that happen?
El Niño is characterized by, among other things, a large footprint of warmer-than-normal surface water across much of the tropical Pacific Ocean. This footprint contributes directly to warmer globally-averaged temperatures, in the same way that, if you leave one of your stovetop burners on “warm” the average temperature of the whole stovetop is warmer.
But the warm footprint also adds heat to the atmosphere, just like the warm burner heats the air just above it. The atmosphere carries this along, reinforcing, over time, the direct heating from the “warm burner” in the tropical Pacific.
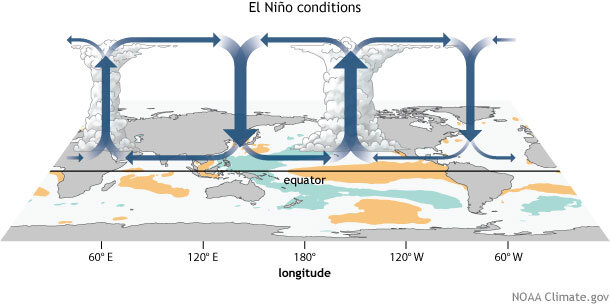
Generalized Walker Circulation (December-February) anomaly during El Niño events, overlaid on map of average sea surface temperature anomalies. Anomalous ocean warming in the central and eastern Pacific (orange) help to shift a rising branch of the Walker Circulation to east of 180°, while sinking branches shift to over the Maritime continent and northern South America. NOAA Climate.gov drawing by Fiona Martin.
It makes sense that, all else being equal, El Niño-flavored episodes, with the tropical Pacific burner on “warm” raise the global average temperature. But is a record-warm year guaranteed? Look closer at the bars: it’s not always so simple. Some red months aren’t taller than their neighbors. And 2014 was nominally the warmest year on record, despite no dominant El Niño to give it a push. What gives? The answer is, “all else” isn’t always equal. El Niño influences global temperatures, but it isn’t the only factor.
The climate is a complex system, with multiple influencers, with different timescales and degrees of impact. ENSO fits into the short-to-medium scale we call “climate variability.” It’s strong enough to influence seasonal outcomes, even the planet’s average temperature, and La Niña episodes sometimes mask (but don’t stop) long-term warming.
ENSO isn’t the only large-scale climate pattern that can do so. In recent years, you may have heard of the Arctic Oscillation which, compared to ENSO, has a shorter life cycle (weeks rather than months-to-seasons) and a more direct impact on regional outcomes. The Pacific Decadal Oscillation, like its name implies, spans decades, putting it on the slower side of climate variability.
These oscillations, or cycles, or “modes of variability” as they are called in the climate business, often involve some kind of interplay between the ocean, its currents, and the atmosphere. During the last year, the “Blob” of extremely warm sea surface temperatures in the northeast Pacific affected Alaskan warmth and the lack of precipitation along the US West Coast. It was captured by some less famous modes of variability itself, ones that focus on the extra-tropical Pacific, such as the East-Pacific/North-Pacific pattern.
Taken together, many of these modes can push the global temperature needle in opposing directions. If an ENSO event is weak, or short-lived, and another mode of variability is powerful, the ENSO “signal” can get lost. However, if an ENSO event is strong and long-lived, it will leave an unmistakable mark on the global temperature. It’s no accident that the big El Niños of 1982-83, 1986-87 and 1997-98 show clear ramps up, and the strong La Niñas of 1987-88 and 1998-2000 (a whopper!) drove temperatures down.
Bringing it back to this year, this El Niño event, as it continues to take hold, will definitely increase 2015’s chances to place among the warmest years, if not the warmest, on record. We’ll touch base again towards the end of the year for a recap. Until then, I hope you’ve enjoyed going Beyond the Data.