July 2015 El Niño update: Bruce Lee?
El Niño continued to build during June, despite some shorter-term fluctuations in the climate system (here’s looking at you, MJO). CPC/IRI forecasters are still very confident that this event will persist through the winter, and they continue to favor a strong event, with the three-month average sea surface temperature in the Niño3.4 region expected to peak at more than 1.5°C above normal.
Nearly all the computer models are in agreement, and the atmosphere and ocean continued to behave in a very El Niño-like manner. So what is there to talk about this month? Well, a few interesting things happened over the past few weeks.
First, a quick rundown of where we find ourselves in the beginning of July
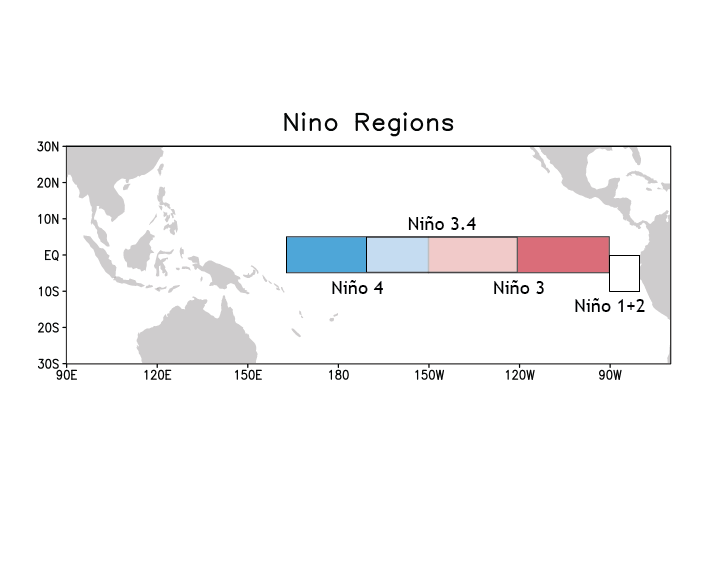
Sea surface temperatures (SSTs) all across the central and eastern equatorial Pacific were more than 1°C above normal, including a June average of 1.0-1.3°C (depending on SST dataset) above normal in the Niño3.4 region, our primary tracking indicator for ENSO events. The gradient in anomalies (anomaly = departure from long-term average) across the Pacific looks like a pretty classic El Niño event.
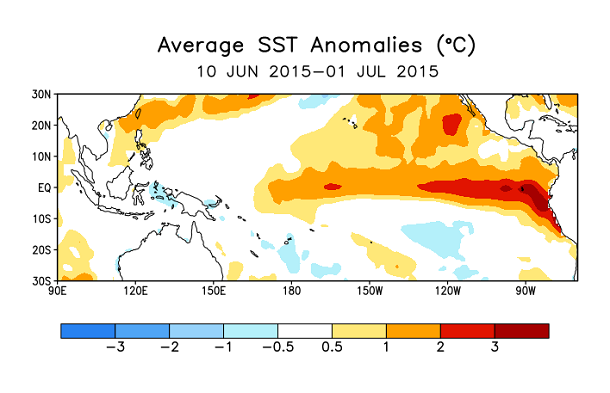
Sea surface temperature departure from normal, averaged 10 June – 1 July 2015. CPC figure.
Averaged over June, we continued to see more clouds and rain than normal over the central and eastern equatorial Pacific, fewer clouds and less rain over Indonesia, weaker near-surface easterly winds, and weaker upper-level westerly winds – all hallmarks of the reduced Walker Circulation characteristic of El Niño.
Which way does the wind blow?
The near-surface winds along the equatorial Pacific (the trade winds) are an important component of the ENSO system. These winds normally blow from east to west; they are usually persistent enough to sweep sun-warmed surface waters into a “pile” in the western Pacific. When they weaken, or even reverse (blowing from west to east), the warmer waters that are piled up in the western Pacific begin to move to the east. During El Niño, we expect these winds to be weaker than normal on monthly and seasonal timescales.
However, it’s normal for the background El Niño signal to be drowned out by short-lived weather patterns over one- or two-week periods. That was the case in the first half of June, when the weakened winds over the equatorial Pacific were temporarily amplified by an active Madden-Julian Oscillation (MJO).
The MJO is an area of enhanced convection and storms that travels around the world from west to east along the equator. Ahead and behind the active stormy area are areas of suppressed convection and drier conditions. The MJO affects near-surface wind patterns, because the rising air in the stormy area causes surface winds to blow toward the active area.
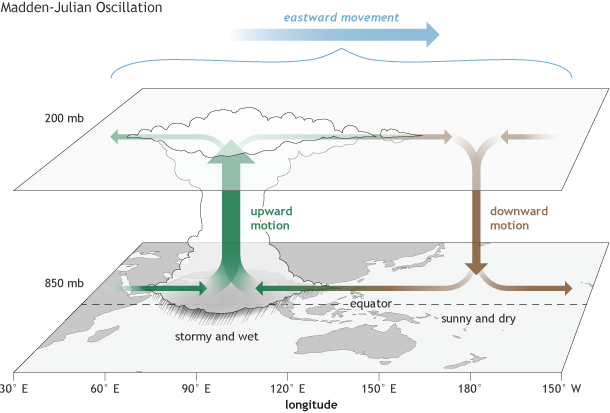
The surface and upper-atmosphere structure of the MJO for a period when the enhanced convective phase (thunderstorm cloud) is centered across the Indian Ocean and the suppressed convective phase is centered over the west-central Pacific Ocean. Horizontal arrows pointing left represent wind departures from average that are easterly, and arrows pointing right represent wind departures from average that are westerly. The entire system shifts eastward over time, eventually circling the globe and returning to its point of origin. Climate.gov drawing by Fiona Martin.
When the active area of the MJO is centered over the Indian Ocean and Indonesia, it leads to drier conditions and easterly trade winds over the tropical Pacific. (For a thorough description of the MJO and its interaction with ENSO, check out this post.)
In the first half of June, the MJO was traveling through the Indian Ocean and Indonesia, which put an area of suppressed convection over the tropical Pacific. The related strengthening of the easterly trade winds and drier conditions over the Pacific temporarily weakened the atmospheric signal of El Niño conditions. (This is a good example of the short-term variations that Michelle discussed in her post couple of days ago.) But as soon as the MJO moved along, El Niño conditions strengthened again, and the monthly average conditions remained consistent with El Niño.
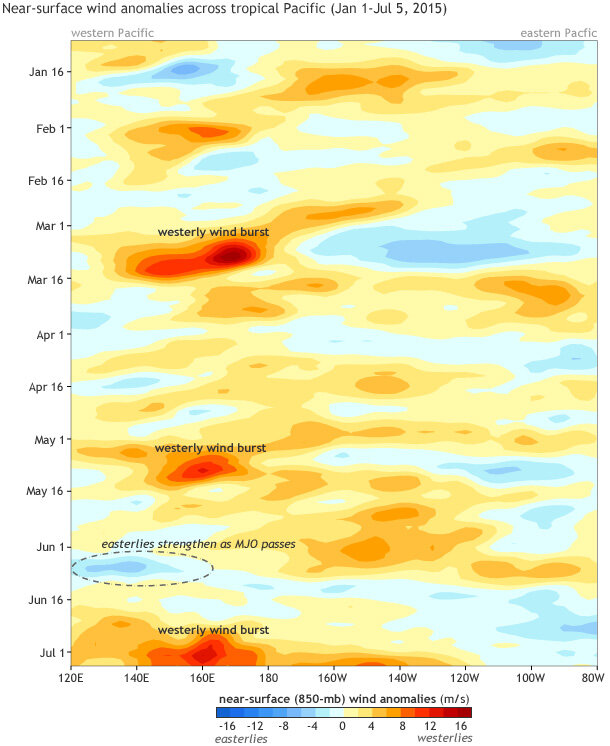
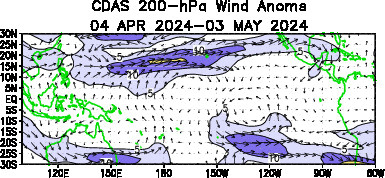
Difference from average near-surface winds in the tropical Pacific (120°E to 80°W). Each row in the plot is the daily average wind anomaly at 850 millibars from January (top) through early July 2015 (bottom). The stronger-than-average easterly winds caused by the MJO in early June first show up as a light blue area (circled). Over the next two weeks, the blue area moves east, sloping toward the bottom right of the image. For more on how to interpret these Hovmoller graphs, check out Tom’s post. CPC figure.
As I mentioned above, sometimes the easterly trade winds will weaken so much that they reverse, and blow from the west. A reversal of these winds tends to last only a week or two—an episode we call a westerly wind burst. Often, but not always, a westerly wind burst will kick off a downwelling Kelvin Wave, where a warmer-than-average pulse of subsurface waters travels east across the Pacific.
Two strong westerly wind bursts, in the first half of March and the first half of May, preceded the downwelling Kelvin waves during this spring and early summer, and as a result, contributed to the fairly impressive El Niño we see now.
During the end of June and first week of July, another very strong westerly wind burst occurred in the western Pacific, on the heels of the MJO event. It is likely that this westerly wind burst will reinforce the movement of warmer waters to the east, maintaining and probably strengthening this El Niño.
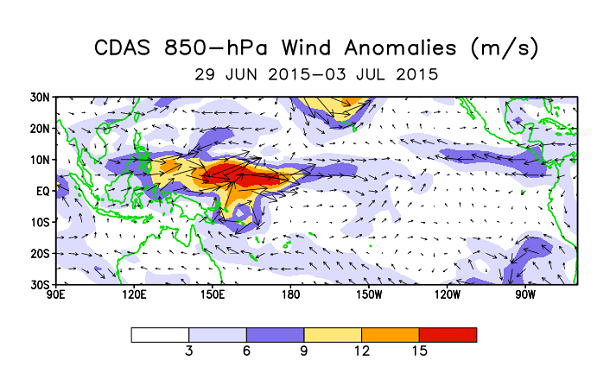
Near-surface wind average and departure from normal over the tropical Pacific, averaged from 29 June to 3 July 2015. CPC figure.
What’s in a name?
Tropical storms and hurricanes have been given names since the early 1950s, which helps to clarify communications. In recent years, the Weather Channel has attracted attention by naming winter storms, perhaps with similar intentions. “So why don’t we name ENSO events?” you ask. Excellent question! I propose we do name them, starting this year. Since I think we should have a theme to the names, and the theme should be action movie stars, I hereby designate the 2015-2016 event as El Niño Bruce Lee.

Statue of movie star and martial artist Bruce Lee on the Avenue of Stars of Hong Kong. Photo by Soerfm from Wikimedia.org.
Comments
impact of the El Niño phenomenon in the Arabian
RE: impact of the El Niño phenomenon in the Arabian
Here are some related papers/abstracts you can read:
http://journals.ametsoc.org/doi/abs/10.1175/JCLI-D-14-00388.1
http://journals.ametsoc.org/doi/abs/10.1175/JCLI-D-12-00306.1
http://journals.ametsoc.org/doi/abs/10.1175/WAF-D-15-0011.1
In general, there are a lack of strong and statistically significant relationships between El NIno and the Arabian Peninsula. But some of these papers indicate that if certain conditions are also observed in the Indian and western Pacific Ocean, then there might be more of a relationship. The Kang et al. paper suggests there is a decadally varying relationship between rainfall and El Nino, such that between 1981-2010, El Nino led to more rainfall, but in the decades previous to that (1950-79), there was an opposite relationship (El Nino was related to drier conditions).
RE: impact of the El Niño phenomenon in the Arabian
I would posthumously name El
RE: I would posthumously name El
Brilliant.
Comment
If you don't mind me asking,
RE: If you don't mind me asking,
I'm not an expert, but my understanding is that Peru has a dry season that lasts approximately between April and October. During this season it is pretty difficult to get rainfall (not unheard of!) because the waters off the coast of Peru are colder. Colder water inhibits rainfall. So, El Nino means that cold water near Peru is warmer than normal, but it is usually still to too cold to cause rainfall. This will change as we get closer to November and is why Peru recently declared a preemptive state of emergency.
Naming La Niñas
Can we call MJO as strong
RE: Can we call MJO as strong
The location of the MJO can influence the strength of the Hadley circulation at certain positions (longitudes) depending on where the enhanced and suppressed phases are located. More here: https://www.climate.gov/news-features/blogs/enso/what-mjo-and-why-do-we…; ... where rainfall is greater than average, you can assume there is more rising motion and as a result the north-south oriented overturning circulation (Hadley) in that region is increased. But the opposite is true when rainfall is less than average.
This blog
California Rain
RE: California Rain
The much above average waters off the Gulf of Alaska are definitely not due to Fukushima. Check out Dennis Hartmann's response to a comment on his blog post about the source of the warm waters.
Cailf. drought
RE: Cailf. drought
A strong El Nino event does "tilt the odds" for rain in California over the winter, but it's not a guarantee. Check out this blog post to understand more about US El Nino impacts.
naming of La Niña events
RE: naming of La Niña events
Fantastic! Thanks for this great list.
Delores
RE: Delores
It is not so clearcut to attribute the above-average water temperatures off of Baja and California to the current El Nino. Sometimes warmer than average water appears off those coasts after an El Nino has been around for 3-6 months, such as during the summer following an El Nino that peaked the previous winter. Last winter we did have a borderline El Nino, but it's hard to point to that as the cause of the warmth off the mid-latitude North American West Coast. It seems more reasonable to watch for warm waters there NEXT summer, assuming that we have a significant El Nino event this coming winter. Another possible association with your warm waters off the SW US coast could be the Pacific Decadal Oscillation (PDO), which may be beginning to be in positive phase now, following 15 or so years in mainly negative phase from 1999 to 2013. But it's hard to be sure it has switched to positive phase before waiting another year or two to be sure. The PDO has a signal in the water temeprature off of California. As for more tropical storm activity in the eastern North Pacific this summer and fall, yes, there is an established positive association with El Nino. Getting rain in July in southern California has been an extra bonus, though, as even in the most active years for tropical storm activity it is an extreme rarity!
ENSO, Cali and Hurricanes
RE: ENSO, Cali and Hurricanes
Yes, there is a positive statistical relationship between El Nino activity and eastern North Pacific (and central North Pacific) tropical cyclone activity. Right now, the El Nino in progress is featuring sea temperatures that are far above normal in the far eastern part of the tropical Pacific (the so-called Nino1+2 and eastern part of the Nino 3 regions). And this month, sea temperatures are also far above average off the coast of Baja California. Although I cannot prove it, I strongly suspect that this very warm water off Baja played a role in the recent tropical cyclone activity in the eastern Pacific, and Dolores. Of course it is VERY unusual for a tropical storm to "hit" anywhere in the vicinity of southern California, where sea temperatures are usually far too cold to support such storms from coming so close to the region. The extent to which the El Nino played a role in the warm sea temepratures off Baja is unclear. Sometimes an El Nino during a given winter (we had a borderline one during winter 2014-15) leads to warm waters farther to the north, such as off the California coast. A switch to a positive Pacific Decadal Oscillation (PDO) is another possible reason for the warm water off Baja and southern California, but it is not clear the PDO has actually switched to its positive phase at this time. So, in conclusion, Dolores was very likely associated with the warm water off Baja. But just why that water is warm, is less certain. The current El Nino may be playing some role, last winter's borderline El Nino may have also played some role (with a time delay), and the PDO may be playing some role.
Minor snark
RE: Minor snark
Actually, your comment caused me to evaluate the purpose of the nationality description, and I realized it wasn't even necessary. It's not like "martial artist Bruce Lee" could be confused with anyone else, nor is the article is a comparison of martial arts traditions from various countries or heritages, which might make his nationality relevant. So actually, I think I will just remove the reference altogether.
ENSO naming
Chile situation
RE: Chile situation
Diego, El Nino should increase the chances for a plentiful rainy period in central Mediterranean Chile. Although it is not guaranteed, I would expect a reasonably good chance that in August and/or September there will be above-average rainfall totals in that region. Your winter is only about half over, and the second half may bring wetter conditions, especially since this El Nino is by no means a weak one.
discharge/recharge phase graph
RE: discharge/recharge phase graph
I'm sorry, I do not see a discharge/recharge phase graph in this particular blog. It is hard to try to explain something without seeing it first.
RE: RE: discharge/recharge phase graph
RE: RE: RE: discharge/recharge phase graph
Here's a response from the scientist at CPC responsible for this figure. This plot is not in the blog post, only on the CPC web site.
The x-axis in the plot shows the anomalous Warm Water Volume (WWV), which measures the total volume of water warmer than 20C. When the depth of the 20C isotherm (D20) is deeper than normal, more warm water resides above D20, and therefore WWV is above-normal with positive anomaly. A shallower D20 indicates WWV is below-normal with negative anomaly. A positive (negative) WWV anomaly is often a precursor for the development of El Nino (La Nina). The plot is used to show the relationship between WWV and NINO3.4 anomaly during the ENSO cycle. For ENSO events before 2000, there is usually a cyclonic progression of WWV and NINO3.4 anomaly in the phase space. However, after 2000 there is a less systematic progression in the phase space and the amplitude of WWV and NINO3.4 anomaly is much weaker. However, during the development of the current El Nino, we see a clear cyclonic progression in the phase space. For example, from January to March 2015, a rapidly increasing WWV accompanied a slowly growing NINO3.4. While from March to June 2015, a slowly growing WWV accompanied a rapidly increasing NINO3.4.
Blog
One last action hero
Volcano talk
Yes, but why do the tradewinds weaken in the first place?
RE: Yes, but why do the tradewinds weaken in the first place?
Excellent question Al. Definitely a topic that we should cover here at the ENSO Blog. It is a little bit of a chicken or the egg predicament. The trade winds can weaken due to an MJO event or simply due to the chaotic nature of our atmosphere. The ocean state itself can also spur a weakening of the trades as well with changes in the ocean temperature gradient between the waters in the west and central/eastern Pacific. The hard part is teasing out what came first as this is all very much a coupled system. The oceans can change by responding to changes in the wind which then can cause a further changing of the winds, which can then cause a change in the ocean and so on. So to answer youe question, it is somewhat related to the piling up of warm water in the western equatorial Pacific but it could be caused by something as simple as natural variability as well.
El Nino
Godzilla or Bruce Lee El Nino?
Techtonic activity giving rise to SST anomalies
Comments have been disabled on this article