January 2024 El Niño update: for the birds
El Niño is very likely close to peak strength and is likely to continue for the next few months, while gradually weakening. Despite the expected weakening of El Niño’s tropical Pacific sea surface signature, impacts to global climate will continue for the next few months. Forecasters currently expect ENSO-neutral conditions (ENSO = El Niño/Southern Oscillation, the whole El Niño & La Niña system) by the April–June period. After that… you’ll have to read on to find out!
A bird in hand
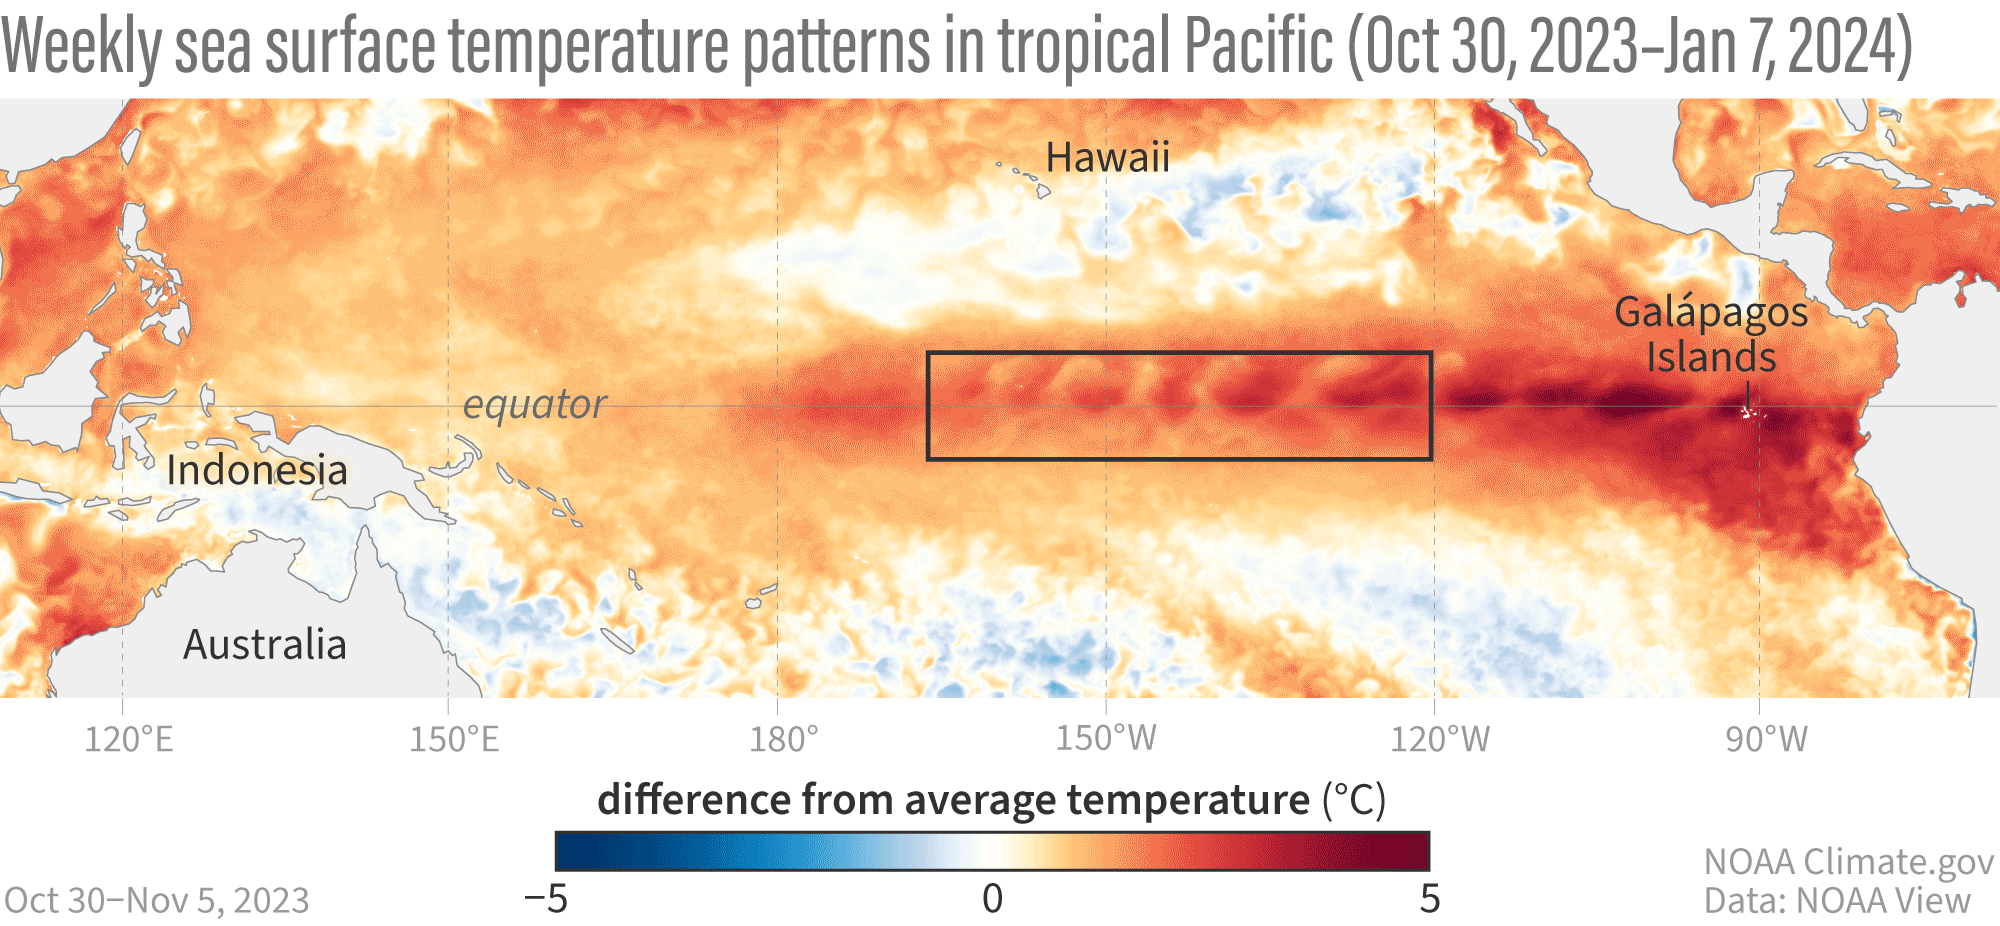
Animation of maps of sea surface temperatures in the Pacific Ocean compared to the long-term average over five-day periods from the end of October 2023 to early January 2024. The waters in the key monitoring region, which scientists call "the Niño-3.4 region," are consistently warmer than average (red), reflecting the mature El Niño. NOAA Climate.gov, based on Coral Reef Watch maps available from NOAA View.
Decades of observations have shown us that it’s typical for El Niño’s sea surface temperature anomaly (anomaly = difference from the long-term average) to peak around December or early January. In December, the sea surface temperature in our key tropical Pacific monitoring region (dubbed “the Niño-3.4 region”) measured 2.1 °Celsius above the 1991–2020 average, the current averaging period, according to our most reliable long-term sea surface temperature dataset, the ERSSTv5.
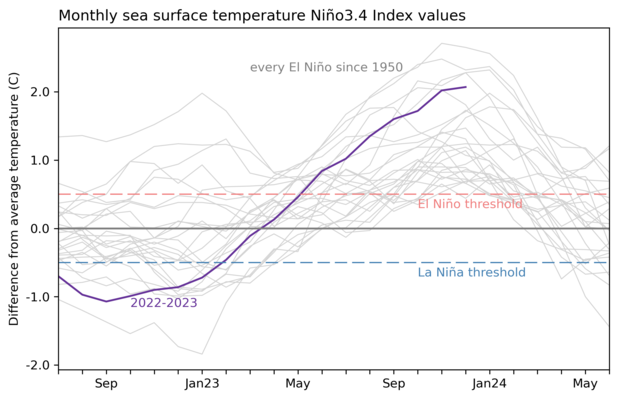
The informal threshold for a “very strong” El Niño event is 2.0 °C above average, so we’re there for the second month in a row. To qualify as a very strong event in our official record, however, we’ll need to see the three-month-average Niño-3.4 index, the Oceanic Niño Index, meet or exceed the threshold. If January’s Niño-3.4 index ends up at 1.9 °C or greater, the November–January Oceanic Niño Index will qualify.
El Niño is a coupled system, meaning both the tropical Pacific Ocean and the overturning atmospheric circulation above it—the Walker circulation—are critical components. Over the past few months, we have observed all the characteristics of El Niño’s typical weaker-than-average Walker circulation, including more clouds and rain than average over the central tropical Pacific, as El Niño’s warmer waters lead to more rising air and storms than average (remember this for later in the post!). We’ve also seen the expected drier conditions over Indonesia and the far western Pacific.
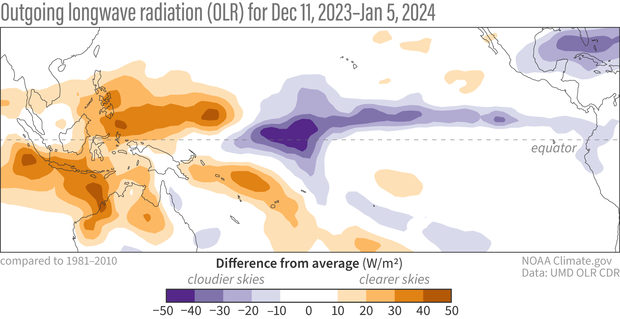
Outgoing long-wave radiation anomaly from December 11, 2023–January 5, 2024. Outgoing long-wave radiation is radiation leaving the Earth's surface. It is blocked by clouds, so areas with more clouds show up as negative outgoing long-wave radiation anomalies. Regions with more clouds and rain than average are shown in blue; areas with fewer clouds and less rain are shown in orange. Climate.gov image from CPC data.
El Niño is also a seasonal phenomenon, lasting for several months in a row. Our requirement to qualify as an ENSO event is that the Oceanic Niño Index stays above the threshold for at least 5 overlapping three-month-average periods in a row. (We call any three-month-average period a “season.”) This El Niño event started in the April–June period and is still going strong, seven overlapping seasons later.
Birds of a feather
Sea surface temperatures change relatively slowly, but atmospheric indicators bounce around a bit more. This is why we look for the monthly or seasonal average atmospheric patterns to reflect El Niño conditions, and we don’t cancel El Niño if a shorter period deviates from what we expect. An interesting current example of this arises from the activity of the Madden-Julian Oscillation, or “MJO.”
The MJO is another pattern of climate variability, operating on intraseasonal (weekly average) timescales, as opposed to ENSO’s seasonal average timescales. In brief, the MJO is a recurring cluster of storms that travels from the west to the east along the equator. This moving cluster of storms is accompanied by changes in tropical winds and can circle the globe in about 30–60 days. Like ENSO, the MJO affects global atmospheric circulation, transmitting its impacts to regions far away from the center of storminess. We’ve written about the MJO before, here and here.
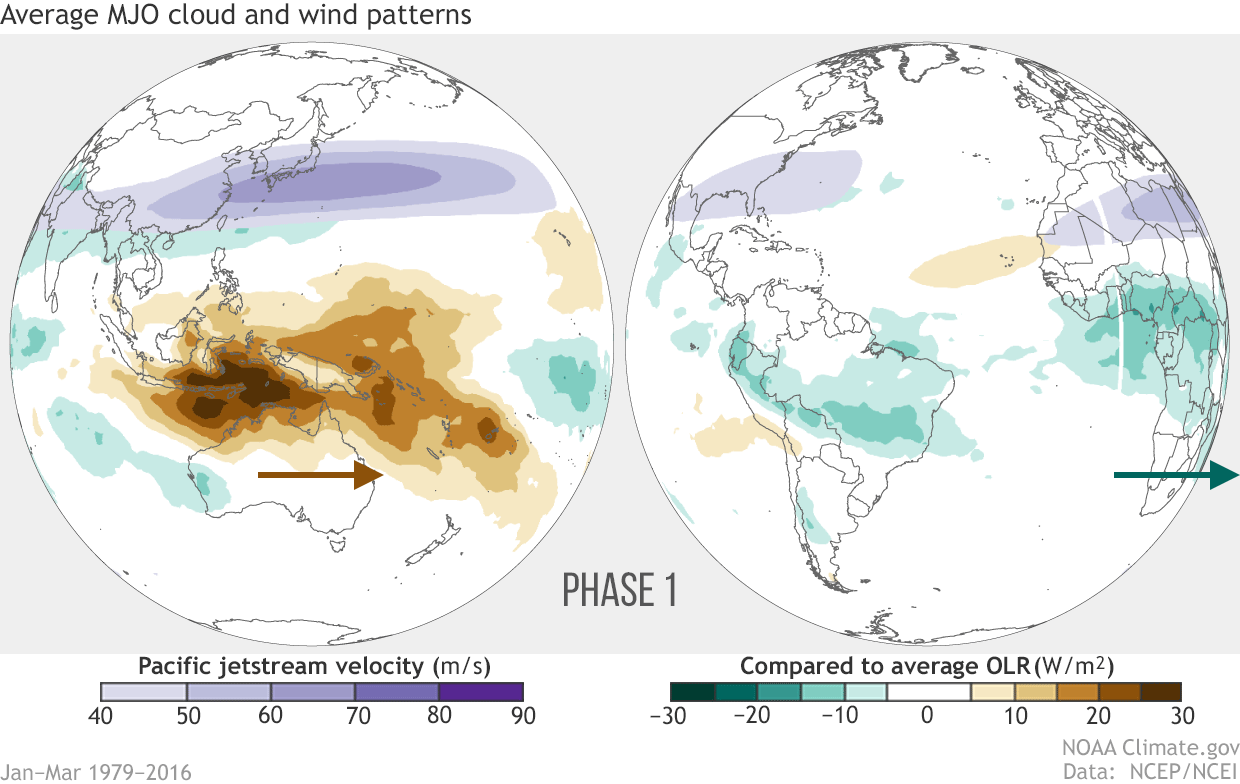
Averages of all January–March MJO events from 1979–2016. Green shading shows below-average OLR (outgoing longwave radiation, or heat energy) values, indicating more clouds and rainfall, and brown shading identifies above-average OLR (drier and clearer skies than normal). The purple contours show the location and strength of the Pacific jet at the 200-hPa level (roughly 38,000 feet at that location). Note the eastward movement of the wet and dry areas. How far the Pacific jet extends past the international dateline also changes with the phase of the MJO. NOAA Climate.gov animation, adapted from original images provided by Carl Schreck.
As you can see in this animation, the MJO area of increased storms and rain is flanked by drier areas. And, since the MJO moves along the equator, it can travel through El Niño’s territory. This means that the MJO can temporarily overlap with El Niño’s expected regions of drier and wetter conditions, making them more intense. But the MJO can also work against the expected El Niño atmospheric pattern, depending on the MJO’s location.
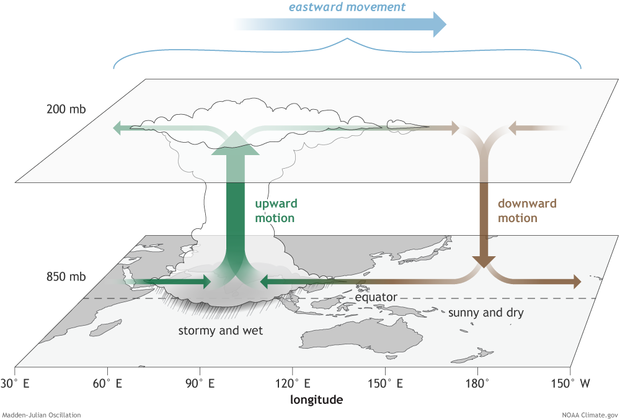
The surface and upper-atmosphere structure of the MJO for a period when the enhanced convective phase (thunderstorm cloud) is centered across the Indian Ocean and the suppressed convective phase is centered over the west-central Pacific Ocean. Horizontal arrows pointing left represent wind departures from average that are easterly, and arrows pointing right represent wind departures from average that are westerly. The entire system shifts eastward over time, eventually circling the globe and returning to its point of origin. Climate.gov drawing by Fiona Martin.
NOAA’s Climate Prediction Center closely monitors the MJO. According to their most recent update, the MJO has been active since early November, and recently completed a circumnavigation of the globe. The MJO team’s update says there was destructive interference—the patterns working against each other’s influence—between the MJO and ENSO in early January, something that shows up when you break the map from earlier up into three periods.
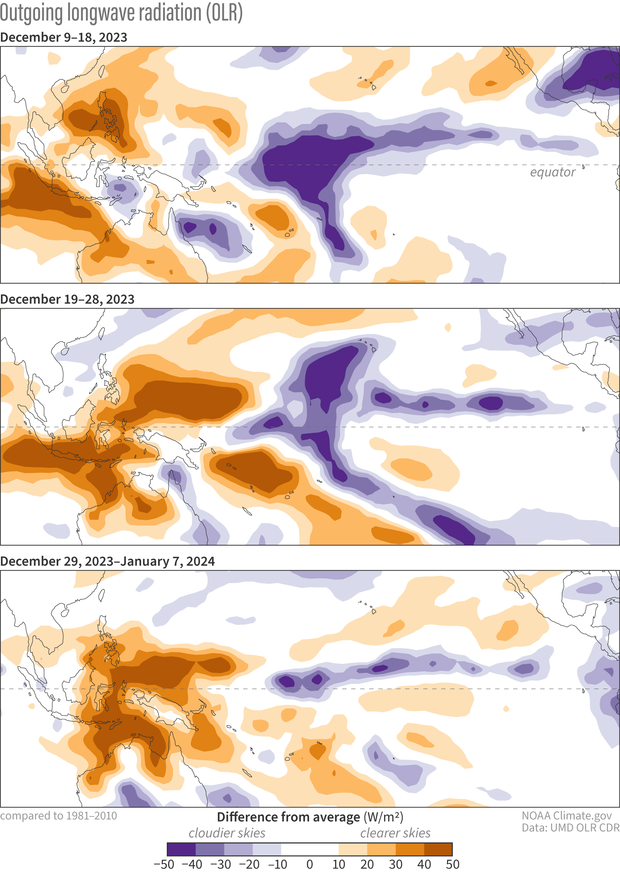
Outgoing long-wave radiation anomaly from December 9, 2023–January 7, 2024, shown as three 10-day-average periods. Regions with more clouds and rain than average are shown in blue; areas with fewer clouds and less rain are shown in orange. Climate.gov image from CPC data.
The bottom panel in particular, the most recent, shows that the increased storminess near the International Date Line (a hallmark of El Niño, as I mentioned above) has been disrupted somewhat, weakening relative to the earlier periods. This is likely the influence of the MJO, which is suppressing rainfall there while increasing rainfall over the Indian Ocean.
The MJO is likely to continue to move around the tropics, where it could eventually enhance the El Niño-related atmospheric patterns again in late January or early February. The MJO is a great illustration of the difference between a seasonal pattern, which shows up in longer averages like monthly or three-month, and intraseasonal variability, which can enhance or oppose the seasonal pattern over a few weeks.
Bluebird
What might we have upcoming? Is that a chance for La Niña flapping its wings in the distance?
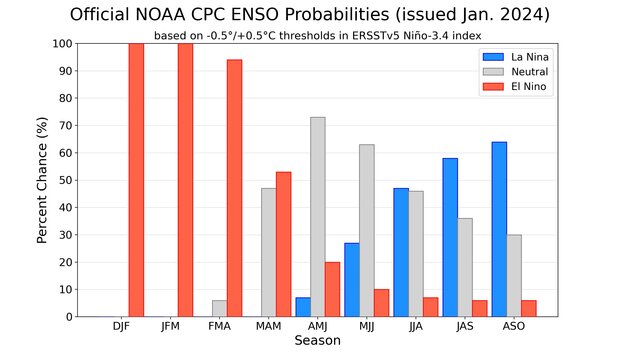
NOAA Climate Prediction Center forecast for each of the three possible ENSO categories for the next 8 overlapping 3-month seasons. Blue bars show the chances of La Niña, gray bars the chances for neutral, and red bars the chances for El Niño. Graph by Michelle L'Heureux.
Chances of La Niña conditions are topping 50-60% by the Northern Hemisphere late summer/fall, as many of our computer climate models are predicting that La Niña will develop. La Niña has its own set of global impacts, of course, including a tendency to increase Atlantic hurricane activity. We’ll be keeping an eagle eye on conditions in the tropical Pacific as this El Niño wanes over the next several months.
Comments
Comment policy
MJO
This MJO is a new concept for me. Fascinating. Great analysis.
EL Nino and MJO
Hi Emily
Great update. To followup on your post. Do you believe the MJO's destructive interference with El Nino forcing is what has caused California to experience drier than normal conditions this winter?
good question
I can't speak for Emily, but I think it's a good question, and I think the MJO interference may be a contributor to the dry start to California's winter. However, I don't see an obvious smoking gun that points to the MJO as the primary culprit.
The situation is sort of like last year but for El Nino this time - the atmospheric circulation has looked pretty similar to what we expect for El Nino, but the anomalous Aleutian low has been displaced a bit north and west of what's typical, and the west has seen more atmospheric ridging than usual. That's what's so tricky about California precipitation - it's sensitive to these details. In any case, perhaps the situation will change if we get some constructive interference between the MJO and El Nino signal.
one more thing
I also want to mention a point brought up by my blog colleague, Michelle, who has shown that much of California has had near-normal precipitation over the past 30 days, and there even are some coastal areas that have been near-normal. When we also factor in that El Nino's influence on California precipitation is strongest from January - March, we're reminded that it's way too early to judge whether this winter is unusually dry for a strong El Nino. I'm sure Michelle will have a lot more to say on the topic toward the end of the month.
El Nino
Thanks Nathaniel!
Unfortunately January doesn't look very good prec wise and the NMME for the remaining winter doesn't look promising either
Temperature and el nino
It's said that 2023 was the hottest year ever.
However the el Nino index was nowhere near the highest.
Is global temperature wrong?
global temperature
I think we can be quite confident that 2023 was the warmest year in the instrumental record despite El Nino coming on in the second half of the year and not reaching record strength. We have to keep in mind that ENSO is just one factor that affects globally averaged temperature. In addition to rising greenhouse gases, there are other human (decreases in anthropogenic aerosols) and natural factors that influence global temperature. We still need to figure out exactly what contributed to the record warmth in 2023, but the different datasets look pretty consistent.
TONGA
Tonga volcano contribuiu parcialmente com o aquecimento?
Tonga
Yes, the Tonga eruption also may have contributed to the warming in 2023. Specifically, the injection of water vapor into the stratosphere from the eruption likely caused some warming (which is very different from the injection of sulfur dioxide from land-based volcanoes, which usually causes a temporary cooling of the globe).
SOCIAL SCIENCE
My comment is all about the El ninlo and La nina , what simply caused it to happen?
El Nino and La Nina ping-pong
Enjoyed this update, thanks ENSO team!
Looking at the ENSO record, the shift back to La Nina after El Nino is typical like clockwork.
However, looking at the record (back to 1950 anyway...) it is interesting to see what looks like a, hmmm... "whipsaw anomaly"(?) - ENSO phases going from La Nina three-peat, to the current El Nino, back to a projected La Nina! If ENSO does go to La Nina this autumn, there will have been no sustained (longer than 9 months) 'ENSO Neutral' period intervening in the past 5 years?
Maybe looking to 1950 isn't far back enough to have a real grasp of trends. But such a "whipsaw" (maybe there's a better term) certainly would stand out in the 74 year record.
whipsaw
Yes, it has been an interesting period! The transition from strong El Nino to La Nina is typical, whereas the opposite transition is not as common. This relates to the asymmetry between El Nino and La Nina that I discussed a few years ago.
Also, I agree that it is interesting how we have not been seeing prolonged neutral periods lately. Because ENSO has so much natural variability, we need really long periods (or lots of reliable model simulations) to determine whether any trends are significant. However, see this post for an argument that we have seen a trend in these big swings from El Nino to La Nina and vice versa over the past century.
Normal seasons
I studied and worked long term forecasting and it appears we rarely see normal seasonal patterns in the last 40 years. It is very LA Nina / El Nino dominant causing IMHO very extreme weather events. Global warming which people deny are mysteriously getting worse. We are missing something in its cause.
About possible another multiyear la niña
Probably will happen another multiyear la niña again. 24-25 and 25-26 (perhaps more)
PDO continue quite negative.
Also, multiyear la niña happened after super El niños 72-73 , 82-83, 97-98 and 15-16.
After super El niño 72-73 - la niña 73-76
After super El niño 82-83- la niña 83-85 and borderline la niña early 1986
After super El niño 97-98 - la niña 98-01
After super el niño 15-16 - very weak la niña 16-17 and la niña 17-18
After super El niño 23-24 - la niña 24-26?
Also, actual El niño is similar a January 2016. January 83 and January 98 the strongest anomalies were in region nino 1.2. January 16 and January 24 the strongest anomalies were in niño 3.4 and niño 3
It's entirely possible!
It's entirely possible!
Effects of MJO on Afghanistan
Thanks for a fascinating read. I'm working on agricultural development in Afghanistan. A wet winter had been predicted - putting an end to a long drought usually blamed on La Niña - but so far there has been no precipitation at all. Could that be related to the MJO effect? Unfortunately your maps don't cover Afghanistan.
I think it's challenging to…
I think it's challenging to say whether a seasonal forecast is a "bust" or a "failure" in mid-January. Also keep in mind these outlooks are probabilistic, so they will not happen 100% of the time.
Will the NASCAR races in Daytona Beach next month be affected???
I was looking around this website to try and see if there are any predicted "El Niño-related weather effects" on the "NASCAR race weekend" this year in Daytona Beach, Florida (February 15th through February 18th, 2024), but all I could find were monthly outlooks (which do show about a 70% chance of above-average rain for February amd March...could somebody in your department share anything "more specific" for those "race days" in Daytona??? I really only care because I have tickets for all four days and I just totally hate it when races are delayed and/or postponed because of rain, so I would really like some "fair warning" if you folks think El Niño is going to "wreak havoc" on NASCAR in Daytona next month...
Hi Ron, the Climate…
Hi Ron, the Climate Prediction Center also puts out forecasts for weeks 3 and 4 which covers this date. You can take a look here.
https://www.cpc.ncep.noaa.gov/products/predictions/WK34/
About Enso peak
Why do Enso (sea surface temperature anomaly) normally peak around December or early January?
A great question. Ocean…
A great question. Ocean temperatures across the tropical Pacific Ocean naturally tend to have their greatest difference (from west to east) during the northern hemisphere winter. The cold tongue which extends across the central/eastern Tropical Pacific is also climatologically at its strongest and extends farthest west at this time.
This helps to maximize the impact from a warming (or cooling) of waters in the central/eastern Pacific associated with El Nino (or La Nina). Which then helps to make the Nino3.4 index the largest at the same time.
It is this gradient in SST's which helps to drive the atmospheric response in El Nino. Maximize the gradient, maximize the impact.
Does MJO affect the Jetstream over the midwest?
I am a science teacher and curious about the effects of MJO on the Midwest. Is the Jetstream over N. America disrupted the same way as the Pacific Jetstream? My students would love to hear from you. Thanks. :-)
Yep! If you look at the…
Yep! If you look at the large MJO phase figure above, in the right-side globe, you can see the jet over the southeastern US and how it shifts with MJO phase. While this purple blob looks like it just fidgets back and forth over the southeast, it has implications for weather through the eastern half of the US.
Comments have been disabled on this article