September 2018 ENSO Update: back to school
What’s happening in the exciting world of ENSO prediction? I’ll tell you! While neutral conditions reign right now, we’re still expecting El Niño conditions to arrive later this fall (50-55% chance). By winter, the chance of El Niño conditions increases to about 65-70%.
The now
Things are definitely looking pretty neutral right now in the tropical Pacific. The most recent weekly temperature in the Niño3.4 region, our primary index for monitoring the El Niño-Southern Oscillation (ENSO), was 0.3°C above the long-term average. Most of the equatorial Pacific surface water temperatures are slightly above average, while some areas of slightly cooler-than-average sea surface waters have recently emerged in the eastern Pacific. (By the way, the NOAAView Data Exploration Tool is a great place to look at recent and historical sea surface temperature patterns, as well as a whole host of other maps.)
The atmosphere is also rolling along in neutral, with the last vestiges of the La Niña-ish cloud/rain pattern in the tropical Pacific dissipating over the past couple of months. During August, most of the tropical Pacific featured near-average cloudiness.
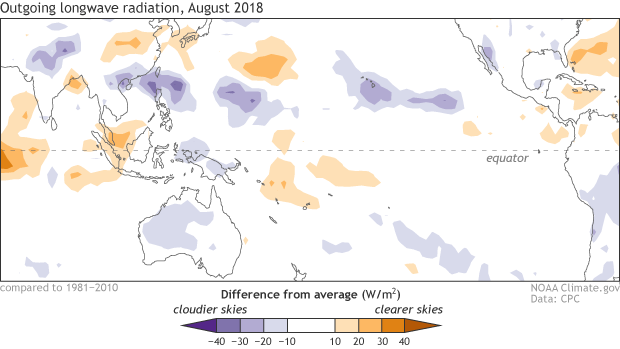
Places that were more (purple) or less (orange) cloudy than the 1981-2010 average during August 2018, based on satellite observations of outgoing longwave radiation (heat). Thick clouds block heat from radiating out to space, so less radiation equals more clouds, and more radiation equals clearer skies. Climate.gov map from CPC OLR data.
Things are looking up
Most climate models are predicting that sea surface temperatures will cross the El Niño threshold (0.5°C above the long-term mean) by the fall. This warming is one major factor in the forecast for a 50-55% chance that El Niño conditions will develop in the next few months.
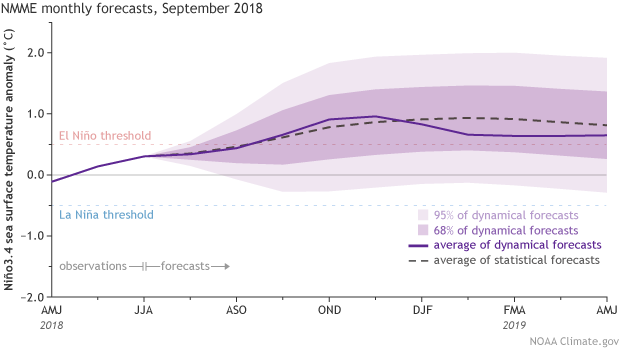
Climate model forecasts for the Niño3.4 Index. Dynamical model data (purple line) from the North American Multi-Model Ensemble (NMME): darker purple envelope shows the range of 68% of all model forecasts; lighter purple shows the range of 95% of all model forecasts. Statistical model data (dashed line) from CPC’s Consolidated SST Forecasts. NOAA Climate.gov image from CPC data.
There are several physical factors that bolster the model forecasts, too. For one, the equatorial Pacific subsurface heat content, which measures the amount of extra warmth in the Pacific Ocean waters between the surface and depths of about 1000 feet, is still elevated. A downwelling Kelvin wave—a large blob of warm water that gradually sloshes eastward under the surface of the equatorial Pacific—was reinforced by some changes in the winds above the tropical Pacific in early August. As this Kelvin wave moves eastward, the warmer waters will rise, providing a source of warmer water for the surface over the months to come.
Wait, what? Westerly winds? Wow!
We watch the winds in the tropical Pacific closely, because they’re a critical component of ENSO. On average, these winds (the trade winds) blow steadily from the east to the west along the equator, cooling the surface of the eastern Pacific and pushing warm water toward the west. When the wind pattern changes, the ocean can change.
The language around winds is one of the more confusing things in meteorology and climatology. Since the trade winds normally blow from the east, they’re called easterly winds. When the easterlies slow down, we call that change a westerly anomaly. If the anomalies are strong, sometimes they’re called a “westerly wind event” or “westerly wind burst.” Rarely do the trade winds actually reverse direction—that usually only happens during a strong El Niño like 1997–98 or 2015-16. But just weakening is enough to change the circulation in the ocean.
Over the past few months, we’ve seen some westerly wind anomalies, including the one in early August that reinforced the downwelling Kelvin wave. Nothing exceptionally powerful in the winds, but enough to provide some confidence to the forecast that El Niño conditions are on the way.
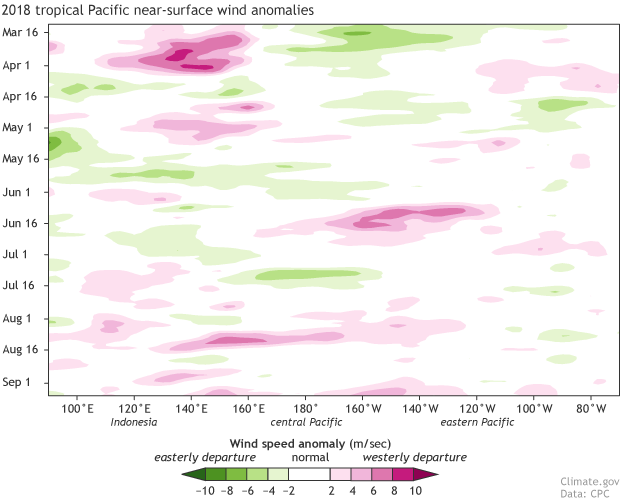
Near-surface wind anomalies over the tropical Pacific (5°N-5°S) during 2018, starting at the top in March and ending in early September at the bottom. Each row in this type of image is the departure from average (1981-2010) at that time. NOAA Climate.gov image, based on data provided by the Climate Prediction Center.
Last month, a reader asked if hurricanes in the tropical Pacific such as Hector could cause changes in the trade winds. It’s an excellent question—the winds on the south side of a northern hemisphere tropical storm like Hector do blow pretty powerfully from west to east. (They are rounding the eye of the storm along a counter-clockwise arc.) This is something scientists have been studying almost as long as we’ve been studying El Niño! Like most things involving the Earth system, it’s complicated, and not always clear what’s the tail and what’s the dog.
Very simply, if a storm is close enough to the equator, its winds may influence the trade winds and create a westerly wind anomaly. As far as Hector goes: you can see from this National Hurricane Center animation that the tropical wind field did not extend below about 12° north of the equator, probably not far enough south. Some weak westerly wind anomalies were observed during early August in the region of 140°W longitude, though! Were they related to Hector? Or were they caused by something else, and may have influenced Hector? (Oh yeah, westerly wind anomalies can affect tropical storms, too.) This requires more study!
A blast from the past
Four years ago, we were looking at a 55% chance of El Niño conditions developing during September–November, with a 65% chance they’d develop by winter. That sounds familiar! Back then, Michelle did some analysis regarding the onset time of El Niño conditions that is worth revisiting. An updated plot using the latest ERSSTv5 data finds that in recent decades, El Niño onset has tended to be in the second half of the year.
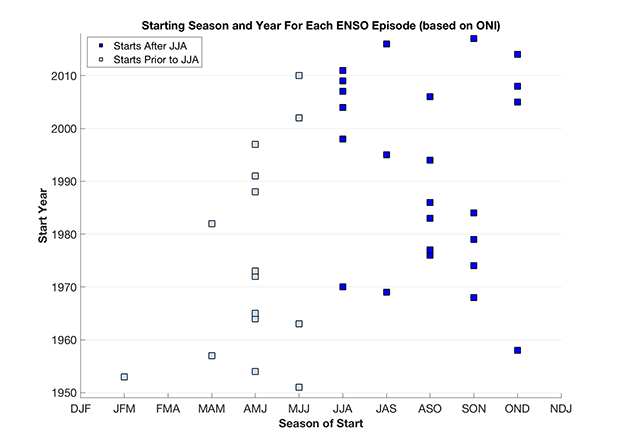
Start time for each El Niño or La Niña event since 1950. Figure by CPC from historical ONI index data.
ENSO, of course, is a coupled system. The expectation is that when the sea surface temperatures in the central and eastern Pacific warm above the El Niño threshold, there will be increased rising air and cloudiness in the central Pacific, which changes the entire atmospheric circulation over the tropical Pacific, weakening the Walker circulation.
In 2014, the surface did warm, mostly hovering right around the El Niño threshold of 0.5°C above average through the winter. But, the El Niño atmospheric response didn’t kick in until the following spring, at the start of the mammoth 2015-16 event. That kind of borderline situation happening again isn’t impossible, but we think it’s less likely this time. In August 2014, convection over the western Pacific and Date Line looked more like La Niña (suppressed) than a developing El Niño. The fact that we presently do not have a La Niña-like convection pattern is one promising sign, among the many outlined above. Thus, our current forecast continues to favor the formation of El Niño conditions this fall.
Comments
Modoki?
Atlantic Hurricanes During El Niño
Points on graphic illustration
RE: Points on graphic illustration
Thanks for the suggestion! I'll take it to our graphics team.
Changing averages?
RE: Changing averages?
Your question makes perfect sense! For ENSO prediction, we update the period that defines "average" every five years, so the +0.5C is relative to the most recent 30-year period, currently 1986-2015. There's more information here.
el niño
RE: el niño
Thanks for reading, Grandpa Garry!
Implications
RE: Implications
Hello! The effects of ENSO in northern Europe tend to be less consistent than in other parts of the world. You can check out our maps showing the ENSO teleconnections here; as you'll notice, El Nino winters tend to be a bit cooler and drier than average in Sweden, but the correlation is not strong, meaning this isn't a particularly consistent effect. The UK Met Office has some information on European ENSO teleconnections, here. Interestingly, their analysis has found that weaker El Nino events are related to cooler winters over Northern Europe, but strong El Nino events have the opposite effect. So... maybe you can plan to build a few more snowmen this winter, given the likelihood of a weak El Nino?
1. Absolutes 2. Causality
Comments have been disabled on this article