Changes in ENSO impacts in a warming world
At the ENSO blog we’ve spoken previously of the latest research into human-caused climate change and El Niño Southern Oscillation (ENSO). So you might be thinking, “Why another article? Didn’t you cover everything already?” Well, first of all, new science comes out all the time and, second, this time instead of looking at ENSO itself, we are going to talk about climate change’s influence on ENSO’s impacts far away from the tropical Pacific Ocean.
Specifically, we are going to look at provocative recent research that suggests that while we may not know exactly how ENSO itself will change in the future, ENSO’s impacts on temperature and wildfire probability in places like North America are likely to get stronger thanks to climate change. Oh, and we’re also going to talk with the lead author of the paper, Dr. John Fasullo.
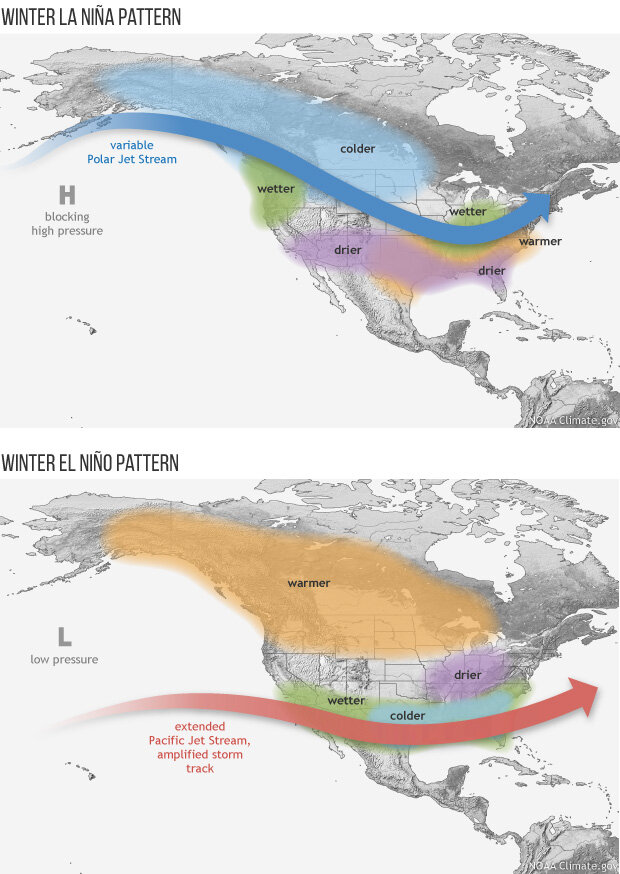
These maps illustrate the typical impacts of El Niño and La Niña on U.S. winter weather. Typical means "common," but not guaranteed because each event is unique. NOAA Climate.gov drawings, adapted from originals by the Climate Prediction Center.
As I previously wrote about for the ENSO Blog, the jury is still out on what sort of changes to ENSO could occur in a warming world. There is evidence for all sorts of outcomes, whether it is more El Niños, stronger overall events, or even a decrease in the number of El Niños or La Niñas. This uncertainty is because ENSO is a complicated give-and-take between the atmosphere and ocean with a lot of different tuning knobs that each get adjusted by climate change. But this doesn’t mean that scientists cannot look at changes to ENSO impacts.
Enter Dr. John Fasullo of the National Center for Atmospheric Research (NCAR) and his colleagues. They took a climate model that generates realistic ENSO events, and ran it multiple times out to the year 2100 using slightly modified input data but with the same increase in greenhouse gases each time. The creation of multiple model runs is called an “ensemble” or different projections for what the future may hold. By slightly changing the beginning data, scientists can observe just how different the future outcomes can be.
The scientists then isolated just the variability associated with earth’s climate system (by essentially removing the background warming after the models were run) to see how ENSO’s impacts on temperature and wildfire probability changed in that warmer world.
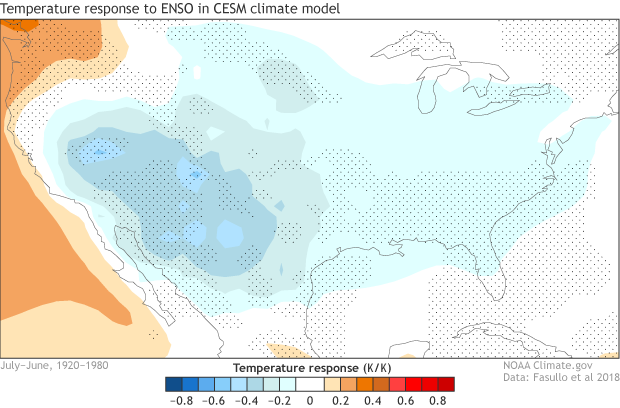
The July-June temperature response to Niño3.4 region sea surface temperature during the twentieth century (1920-1980) in the Community Earth System Model (CESM) for North America. The stippled areas are locations where the statistical significance of the sign of the change exceeds 95%. Blue areas refer an opposite relationship between surface temperatures and ENSO. While red areas refer to a relationship of the same sign. For instance, El Niños are associated with above-average ocean temperatures and below-average temperatures (blue colors in the figure) across the southern tier of the United States. La Niña is associated with below-average ocean temperatures and above-average temperatures (also the blue colors) in the same locations. Units are in degrees K of surface temperature per degrees K of Nino3.4 region sea surface temperature. NOAA Climate.gov modified image from Fasullo et al. 2018.
The authors found an intensification of ENSO’s impact on temperature and wildfire probability over the southern tier of North America (1). This means, for instance, that during El Niños in the future, the colder-than-average temperature signal over the southern tier of the United States was even colder. And since temperature and wildfire probability are connected, it means that the year-to-year wildfire probability anomaly would decrease even more during El Niños in the future (2). For La Niñas, this means that the warmer-than-average temperature signal is even warmer, and that wildfire anomalies would increase even more compared to La Niñas of the past.
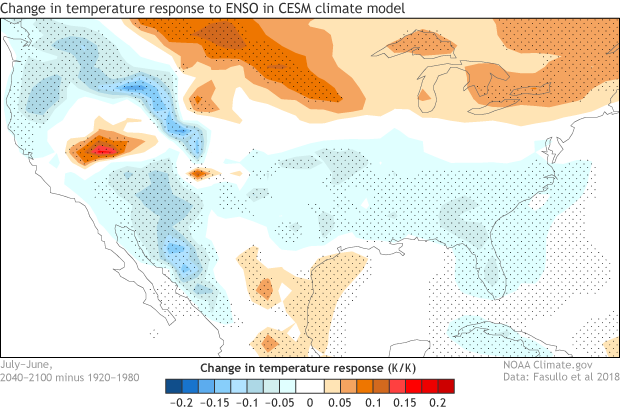
The change in the July-June temperature response to Niño3.4 region sea surface temperature between the twenty-first (2040-2100) and the twentieth century (1920-1980) in the Community Earth System Model (CESM) for North America. The stippled areas are locations where the statistical significance of the sign of the change exceeds 95%. Blue areas refer a stronger opposite relationship between surface temperatures and ENSO in the twenty-first century than the twentieth century. While red areas refer to a stronger relationship of the same sign. For instance, El Niños in the twenty-first century have a stronger below-average temperature response (blue colors) across the southern tier of the United States than in the twentieth century. Units are in degrees K of surface temperature per degrees K of Nino3.4 region sea surface temperature. NOAA Climate.gov modified image from Fasullo et al. 2018.
These findings were backed up by an additional climate model lending credence to the authors’ conclusion.
The scientists even noted that these enhanced El Niño or La Niña impacts occurred regardless of changes in the ENSO phenomenon itself. In fact, the two models they examined have very different projected changes in ENSO. One predicts increased variance (higher highs (El Niño) and lower lows (La Niña), and the other less variance (more muted events). But both indicated that an El Niño or La Niña event of a given strength would produce more extreme impacts in the future.
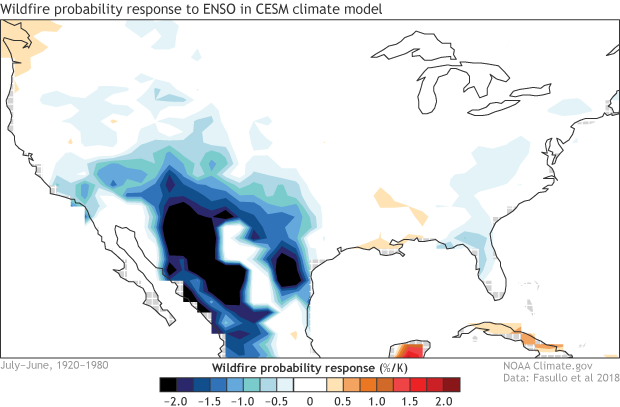
The July-June wildfire probability response to Niño3.4 region sea surface temperature during the twentieth century (1920-1980) in the Community Earth System Model (CESM) for North America. The stippled areas are locations where the statistical significance of the sign of the change exceeds 95%. Blue areas refer an opposite relationship between surface temperatures and ENSO. While red areas refer to a relationship of the same sign. For instance, El Niños are associated with above-average ocean temperatures and below-average wildfire probabilities (blue colors in the figure) across the southern tier of the United States. La Niña is associated with below-average ocean temperatures and above-average wildfire probabilities (also the blue colors) in the same locations. Units are in wildfire probability % per degrees K of Nino3.4 region sea surface temperature. NOAA Climate.gov modified image from Fasullo et al. 2018.
Of course, this research, while provocative, could not discover everything there is to know about future ENSO impacts. The influence of climate change on ENSO’s precipitation impacts, for instance, was less clear, and that could be important when discussing changes in wildfire risk in some regions such as South America (3).
Regardless, this research highlights an important potential climate change impact on seasonal climates across the globe. And additional research will be needed to try and sort the signal out of the noise even more.
Still curious about this research? So was I. Luckily enough for us, Dr. Fasullo was able to take some time to shed more light on what this research means, why it’s important and what questions are left to answer.
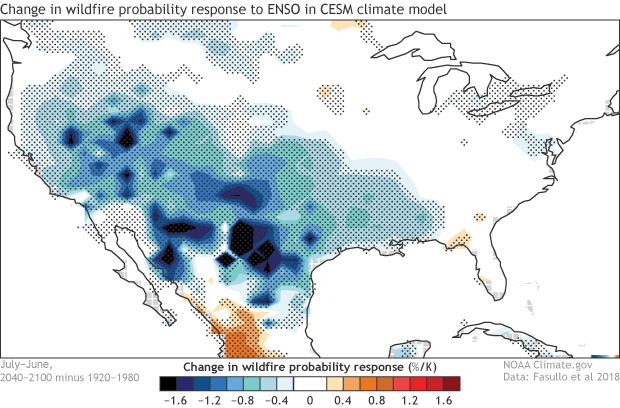
The change in the July-June wildfire probability response to Niño3.4 region sea surface temperature between the twenty-first (2040-2100) and the twentieth century (1920-1980) in the Community Earth System Model (CESM) for North America. The stippled areas are locations where the statistical significance of the sign of the change exceeds 95%. Blue areas refer a stronger opposite relationship between wildfire probability and ENSO in the twenty-first century than the twentieth century. While red areas refer to a stronger relationship of the same sign. For instance, El Niños in the twenty-first century have a stronger below-average wildfire probability response (blue colors) across the southern tier of the United States than in the twentieth century. Units are in wildfire probability % per degrees K of Nino3.4 region sea surface temperature. NOAA Climate.gov modified image from Fasullo et al. 2018.
Question 1: Wait, I thought things would get warmer in the future. Does your research mean that El Niños will make it colder in the southern US, for instance?
Keep in mind that I’m essentially subtracting out the background warming and isolating the year-to-year variability associated with ENSO. So if the variability increases, and the background warms, the cold extremes are made less extreme and warm extremes get even warmer. For the southern tier of the United States, the cooling associated with the intensification of the ENSO impact on temperature would be overwhelmed by the warming of the background climate.
Question 2: Ok, but how? Do you have any thoughts on just how a warming world makes ENSO’s impacts more extreme?
While the physical mechanisms remain somewhat unclear (as they were not the immediate subject of our study), the answer is likely related to the land-sea contrast seen in the images above. Generally, the land regions where we see the temperature signal increase become drier and experience greater evaporative stress (more liquid water from land evaporating into the air) in a warmer climate. It is likely that this drier base state provides less moisture to buffer the energetic influences of ENSO (such as an increase in sunlight due to reduced clouds), leaving warming as the main response. That said, we have some modeling experiments that will help us isolate this effect and our goal is to answer this question more definitively in the coming months.
Question 3: What led you to investigate changes to ENSO’s impacts due to climate change to begin with?
The influence of recent ENSO events in North America and Australia was pretty extreme. The events included heatwaves in the southern tier of the US in 2011 and floods in Australia in 2010/11 that were so large they caused global sea levels to drop, followed by heatwaves in 2010 and early 2013 (the “Angry Summer").
Question 4: What additional questions did your research raise and where are you investigating further?
We are exploring some issues looking at why there is such a land/sea contrast in the signal, specifically regarding exactly what mechanisms are at play and why extremes over the ocean seem to decrease in some models.
Question 5: What does this research mean for folks living in areas that see considerable climate influences from an El Niño or La Niña?
Fundamentally it means that they need to prepare not only for an increase in climate baselines (warming, wildfire, drought) but also for a likely increase in the “whiplash” from one year to the next of 20-30% , depending on where they live.
Footnotes
(1) For the sake of blog post length, I’ve only written about the findings for North America. The authors also looked at similar influences on ENSO impacts by climate change in Australia and South America to varying degrees of confidence. In short, Australia also saw an intensification of ENSO impacts on temperature and wildfire probability due to climate change in the future. For South America, it was a bit more complicated as ENSO impacts on temperature and wildfire probability were of different signs in some places, and rainfall was identified to be an important influence that is difficult to predict. This indicates that climate change could make El Niño impacts on temperature warmer while also reducing the wildfire probability.
(2) This research was done using regressions, which are expressed as impacts per Nino3.4 sea surface temperature anomaly degree Celsius. Therefore the changes shown are under the assumption that the ENSO amplitude is held constant in the future. But ENSO’s amplitude could change in the future. By how much, though, is a much more uncertain question. For example, it’s possible that the total impact of ENSO could decrease even with an increase in the regression coefficients if we have much weaker ENSO events in the future.
(3) In South America, for instance, potential changes in precipitation could decrease the risk for wildfires even while temperatures increase. This causes an odd scenario where El Niños in the future could increase temperatures more than El Niños of the past but the risk for wildfires could decrease.
Comments
North Texas
Ocean temperatures
ENSO’s impacts on temperature and wildfire in North America
Comments have been disabled on this article