January El Niño update: It’s got a lot going on
Happy New Year! December was an action-packed month, El Niño-wise. We’ll take a look at what happened in the tropical Pacific and around the world.
Out with the old
El Niño put up some pretty impressive numbers in December. The Niño3.4 index, which compares ocean surface temperatures in the east-central Pacific to the long-term average, broke the record in December, coming in at 2.38°C above average, surpassing December 1997’s 2.24°C. (This is using the ERSSTv4, the most historically consistent sea surface data we have.)
El Niño is ultimately measured on seasonal timescales, though, so the average of the sea surface temperature anomaly (departure from the long-term average) over three months is what we really pay attention to. In October–December 2015, the Oceanic Niño Index was 2.25°C, tied with the same period in 1997.
Ranking of October-December average sea surface temperature departures from the mean for all El Niño episodes since 1950. This measurement, the Oceanic Niño Index, uses ERSSTv4 data. Figure by climate.gov, data from CPC.
The atmosphere made a good showing in December, too. Until recently, the atmospheric part of this El Niño was lagging behind the other very strong El Niño years, 1982-83 and 1997-98. However, satellites saw much more cloudiness than average in the central Pacific during the past month, even more than in December 1982 or December 1997).
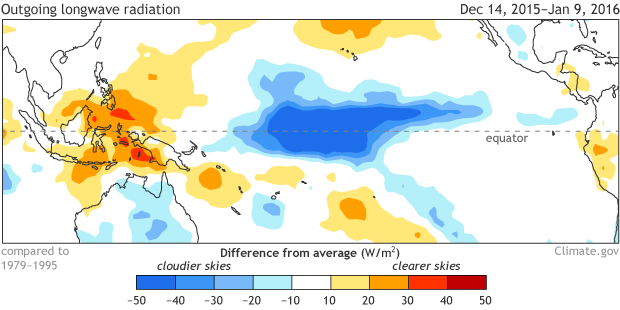
Blocking of outgoing longwave radiation (OLR) during December 2015. Blue shading shows areas where more clouds than average were present, indicated by greater-than-average absorption of surface OLR (less OLR exiting the top of the atmosphere). Climate.gov figure from CPC data.
The Equatorial Southern Oscillation Index, which measures pressure anomalies on either side of the tropical Pacific, was also at record levels for the month. After a fairly moderate response in the low-level winds during December, this month has begun with a strong westerly wind burst. Whether this burst was solely related to El Niño, however, is something we’ll talk about a bit later in this post.
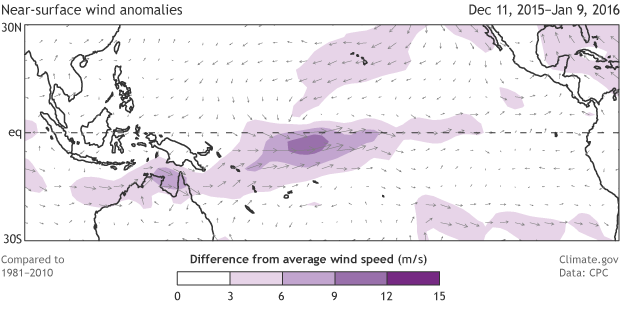
Recent average winds near the surface of the tropical Pacific: departure from the 30-year average. Purple shading area indicates where the normally easterly (blowing from east to west) winds are weaker than normal. Climate.gov image from CPC data.
First, a quick spin around the world
So El Niño is certainly cranking away in the equatorial Pacific. Is it influencing the weather around the world in the ways we’d expect? The main season for El Niño impacts in the U.S. (January–March) is just beginning in the U.S., but it’s winding down in other areas of the world.
Australia’s typical El Niño impact is dry conditions over most of the continent from about July through December, but through this period there hasn’t been a very clear deficit except in portions of eastern Australia. It’s possible that a record warm Indian Ocean had a strong effect on the climate in Australia this year, a reminder that the climate system has a lot of moving parts, and impacts from El Niño are expected, but not guaranteed.
That said, in other areas of the world, El Niño impacts were clearer. Much more rain than normal fell in eastern Africa, as their “short rains” rainy season (October–December) was enhanced by El Niño, while southern Africa has had continued dry conditions. Uruguay, southern Brazil, and Paraguay also experienced a lot of rain, and northern South America has been dry, as often happens in September–December during El Niño.
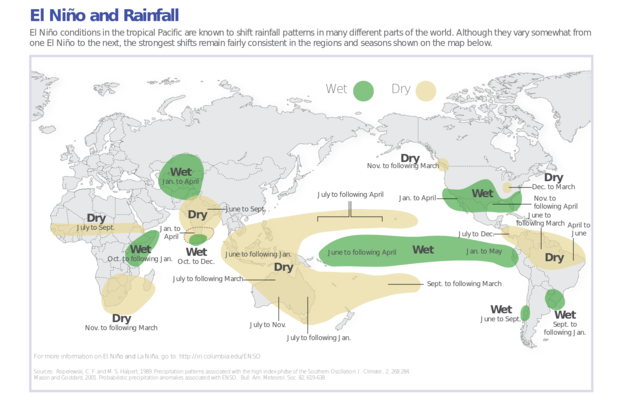
Typical rainfall patterns during El Niño events. Such teleconnections are likely during El Niño events, but not certain. Map by IRI.
You said there was a lot going on. I want more!
El Niño isn’t enough for you? In addition to Michelle’s post about all the different climate patterns that contributed to the record warmth across eastern North America in late 2015, the Madden-Julian Oscillation (MJO) was also active during December and early January. The MJO is a collection of storms and circulation changes that slowly moves eastward around the globe at the equator.
Similar to El Niño, the area of storminess perturbs global atmospheric circulation through tremendous heating on the equator. But unlike El Niño, the MJO passes through an area in a matter of weeks. In December, this large area of storms and convection was moving across from Indonesia through the central Pacific, where the westerly wind burst that I mentioned earlier occurred.
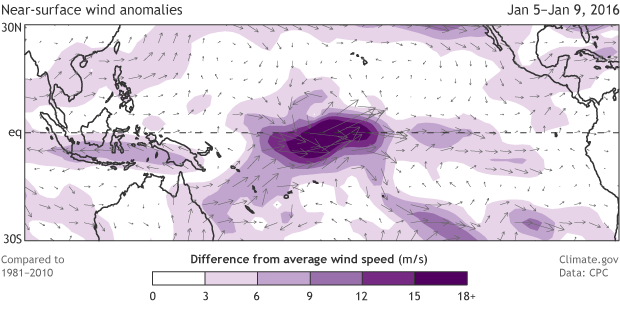
A westerly wind burst during January 5-9, 2016. Purple shading area indicates where the normally easterly (blowing from east to west) winds are weaker than normal or have reversed. Climate.gov image from CPC data.
Remember that El Niño brings weaker easterly trade winds. Sometimes the winds reverse course altogether, and blow from the west. Weaker trade winds help intensify surface warming. Here’s what previous guest blogger Adam Sobel had to say about how the MJO and El Niño could be interacting:
Whenever the MJO acts up during an El Niño event – like now - there is a tendency to say that the MJO is making the El Niño stronger, or even causing it to exist in the first place. A recent article about the MJO in Science started off by claiming that a clutch of MJO events last March caused the onset of the current strong [El Niño] event.
There’s a clear logic to this: westerly surface winds on the equator are a critical part of El Niño, and the active phase of the MJO brings those. And whereas the MJO’s clouds, rain, and surface westerlies normally tend to fizzle when the active phase reaches the Central Pacific, during El Niño, the warmer waters near and east of the dateline allow the MJO to hold itself together longer. This allows the MJO’s westerlies to reinforce surface warming.
But the MJO is, like its name says, an oscillation. The westerly anomalies are followed quickly by easterly ones, so that the average effect might be very little over the longer time scale of ENSO. And we know there would be central and eastern Pacific westerlies during El Niño even without the MJO. Westerlies have been present for the past several months, but for much of that time there has been no sign of the eastward propagation that is the MJO’s trademark.
Clearly, the question of how the MJO and El Niño act to reinforce or weaken each other is still up for debate.
In with the new
Regardless of the cause, there was a very strong westerly wind burst near the Date line early this month. Often, but not always, these wind bursts kick off downwelling Kelvin waves, sending an area of warmer subsurface waters eastward. We’ll have to wait to see if this develops to know what impact it could have on slowing the decay of El Niño through the spring.
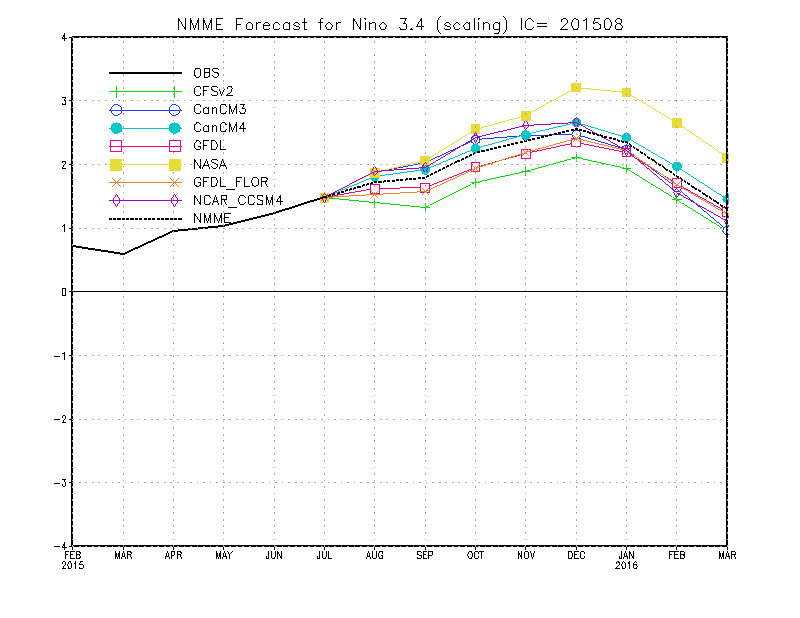
Speaking of the decay of El Niño… since this past summer, computer models have been predicting that December would be the peak in one-month sea surface temperature anomalies in the Niño3.4 region. Forecasters expect the sea surface temperature anomalies in the tropical Pacific to decrease gradually over the next several months, and we’re favoring a transition to neutral conditions by the late spring or early summer. Stay tuned over the next few months to see what impact this very strong El Niño has on the U.S. and the rest of the world.
* Follow Dr. Sobel on twitter: @profadamsobel, and check out his book about Hurricane Sandy, Storm Surge.
Comments
Some questions and comments
El Nino, El Nino, El Nino, etc
RE: El Nino, El Nino, El Nino, etc
Do you think that Hurrican Pali has El Nino impact?
RE: Do you think that Hurrican Pali has El Nino impact?
We'll have to wait and see to discover what the effect the strong westerly wind burst will have on the decay of El Nino. Also, it's difficult to separate out the cause and effect of the MJO, El Nino, and Hurricane Pali in the westerly wind burst, but that will certainly be a research topic going forward.
Strong Westerly Wind Bursts
RE: Strong Westerly Wind Bursts
This westerly wind burst occurred later in the El Nino event than the strong ones we saw during the 1997/98 event (mostly in Oct-Dec 1997). It's a perfect example of how each El Nino is different, and how complex the system is. We don't know yet if or how it will slow the decay of El Nino. In a few weeks, we'll have a clearer picture of the effect of the wind burst on ocean heat content.
high pressure systems & El NINO
RE: high pressure systems & El NINO
Yes, high pressure systems do bring sunny, rain-free weather, but when they are still to the west of a given place, they go along with cool/cold weather, while when they are positioned a little to the east of the place the sunny weather is accompanied by above average temperatures as well. When you are right in the middle of a high, the temperature tends to be average or slightly higher. It depends partly on where the air mass associated with the high came from. In winter, some of these highs come southward out of Canada/Alaska, and they are cold. Others come from the west, from the Pacific, and are more moderate. We also need to clarifiy whether we're talking about high pressure at the surface, or higher up in the atmosphere, such as at 500mb (about 18,000 feet altitude). These high pressure systems tend to tilt to the west with height, so when the high is right over you at the surface, it may still be a bit west of you in the upper atmosphere. There is an upper air pressure pattern associated with strong El Nino events in winter over the US. It consists of a large high pressure center over south-central Canada, the Great Lakes, and extending westward to the northern Rockies and eastward to northern New England. To the south, and covering much of the southern tier of states, pressure is lower, as might be expected with the enhanced extended Pacific jet during El Nino that brings increased storm activity along the southern tier. The pressure pattern typical for El Nino shows up in a long-period average (such as a 2- or 3-month average), and does not apply to shorter time-scales like weekly. Weekly patterns may have a lot of variety and not look like the El Nino pattern. That may be what is happening now, with a high pressure ridge over the western states (SOCAL) and a trough over the eastern states. This pattern may only last several days, or it could go on for a whole week or even more. But our best bet for the whole winter, averaged, would be for lower pressure over SOCAL (and above average rainfall), and higher pressure over the northern tier of states, and a tendency for below normal precipitation in many of the subregions up there, and also above-average temperatures.
During weaker El Nino, and sometimes even regardless of El Nino, there is a tendency for higher than average pressure over the western states and lower pressure over the eastern states, associated with the so-called PNA (Pacific/North American) pattern. During strong El Nino, the PNA pattern tendency becomes the so-called TNH (tropical/Northern Hemisphere) pattern, a clockwise-rotated version of the PNA pattern, with the high over southern Canada/Great Lakes and low over the southern tier of states in association with the enhanced and extended Pacific jet.
MJO vs El Niño
RE: MJO vs El Niño
Certainly the relationship between MJO and El Nino has been studied in a number of ways. I don't think you'll find a simple correlation chart for it. I believe what Adam Sobel was talking about, is that the MJO comes with increased westerly winds on its leading edge. These counteract the usual trade winds in the tropical Pacific, and create conditions consistent with El Nino development. Although the MJO moves through a region pretty quickly (in a week or so) as opposed to the mainly stationary ENSO pattern, it could possibly trigger the onset of an El Nino if one were already tetering on the brink of development. During the onset of the 1997-98 El Nino, in spring 1997, big-time MJO activity caused large westerly wind bursts in the western tropical Pacific that some scientists believe played a critical role in the development of that huge El Nino, or at least made the difference between its being a modest El Nino and a very strong one. The spring is the time of year when small changes can made a big difference in the growth of a phenomenon like El Nino that involves positive feedback between the anomalous winds and the anomalous SSTs. Timing of an MJO is therefore important. If an MJO comes at a non-critical time, it may not have much effect on the ENSO state; it just moves through and things return to how they were before the MJO passed. Remember also that the MJO has an opposing effect when it has passed: there is a suppressed convection region in its wake. So the trick is to get the enhanced convection to combine with the existing conditions in a way that brings the winds above a critical threshold to trigger a Kelvin wave and add to the heat content at the time when it matters for ENSO development.
RE: MJO vs El Niño
RE: RE: MJO vs El Niño
Here are a few links with MJO material that may be what you're looking for. I don't know exactly what kind of material you're after, but hopefully one of these will contain some things about MJO that interest you.
http://www.esrl.noaa.gov/psd/mjo/
http://www.americanwx.com/bb/index.php/topic/30506-mjo-questions/
http://www.nws.noaa.gov/ost/climate/STIP/36CDPW/36cdpw-njohnson.pdf
If will the decay of El Niño...
El Nino does add heat to the
El Nino does add heat to the atmosphere, and enough to raise the global mean temperature noticeably with a lag of about 3-6 months. In other words, the global mean temperature has a peak several months after the El Nino has its peak in SST. Because of this lag of a few months, and because El Nino usually lasts from about July through the following March, it means that the calendar year after the El Nino begins usually has a higher mean global temperature than the year that it begins. Applying this to the current El Nino, it means that 2016 may be even warmer than 2015, and we know that 2015 already is the warmest year on record so far. If the current El Nino decays quickly, 2016 probably won't be quite as warm as if it decays more slowly. We expect neutral ENSO conditions to begin around May or June. But in addition to the timing of when it returns to neutral, the extent of the above-average SST in the coming 2-3 months, when the El Nino will likely still be in the strong or moderate strength category, will also matter. The current westerly wind event will encourage the SST to remain above 2C above normal for a longer time than if this wind event were not occurring.
Thank you
Dec Rain in Middle of US
El Niño end
Agen Judi Online Terpercaya
Agen Judi Online Terpercaya
Comments have been disabled on this article