September 2015 El Niño Update and Q&A
The CPC/IRI ENSO forecast says there’s an approximately 95% chance that El Niño will continue through Northern Hemisphere winter 2015-16, gradually weakening through spring 2016. It’s question & answer time!
How strong is this El Nino now?
The only real way to answer this is to throw a bunch of numbers at you. Essentially, it’s “pretty strong.” The three-month, June-August average of sea surface temperatures in the Niño3.4 region (the Oceanic Niño Index) is 1.22°C above normal, via the ERSSTv4 data set. This is the third-highest June-August value since records start in 1950, behind 1987 (1.36°C) and 1997 (1.42°C).
The August average is 1.49°C, second behind August 1997 (1.74°C). The August Equatorial Southern Oscillation Index (which measures the strength of the atmospheric part of ENSO) was -2.2, second to 1997’s -2.3. There are many ways of measuring El Niño, so the ranking of El Niño will change depending on which variable (winds, pressure, etc.) or time period (monthly, seasonal) you want to examine.
When is El Niño going to hit?
El Niño isn’t a storm that will hit a specific area at a specific time. Instead, the warmer tropical Pacific waters cause changes to the global atmospheric circulation, resulting in a wide range of changes to global weather. Think of how a big construction project across town can change the flow of traffic near your house, with people being re-routed, side roads taking more traffic, and normal exits and on-ramps closed. Different neighborhoods will be affected most at different times of the day. You would feel the effects of the construction project through its changes to normal patterns, but you wouldn’t expect the construction project to hit your house.
Okay, then… but what’s going to happen in my home town?
The expected changes in regional weather patterns due to El Niño are a big part of the NOAA Climate Prediction Center’s seasonal forecasts. Over North America, the Pacific jet stream (a river of air that flows from west-to-east) often expands eastward and shifts southward during El Niño, which makes precipitation more likely to occur across the southern tier of the United States. Check out the winter (December-February) forecasts here.
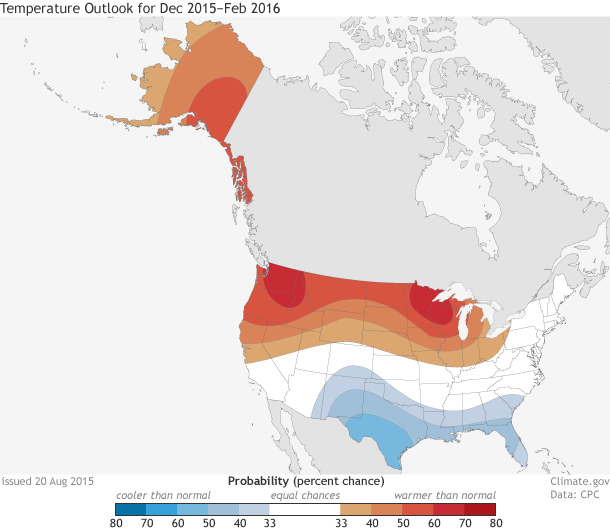
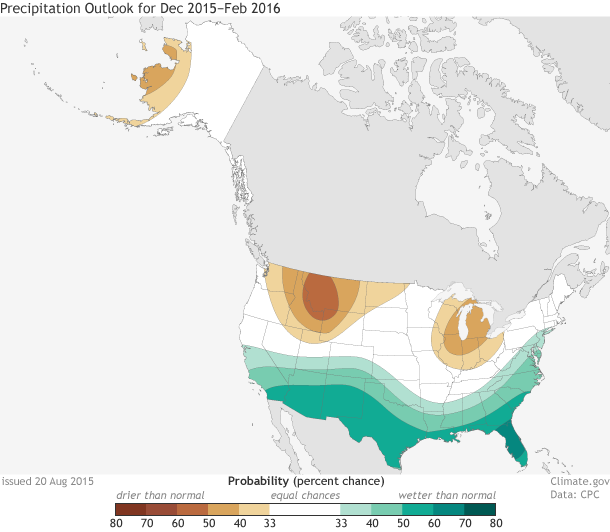
Chances of possible temperature (upper map) and precipitation (lower) outcomes for December 2015-February 2016: above normal, below normal, or near normal. Above or below normal means temperatures in the upper or lower third of the range of historical temperatures. White does not mean "near normal;" it show places where the chances for above-, below-, and near-normal temperatures are equal. Maps by NOAA Climate.gov, based on data from the Climate Prediction Center.
Why winter?
The weather in the winter is controlled more by global atmospheric flow than summer weather is, when small-scale events like thunderstorms tend to be more important. Since El Niño’s remote effects are felt though its modulation of global flow, winter is when the most noticeable impacts occur.
Winter in the Southern Hemisphere is just winding down. Did El Niño have an impact on their winter?
A few months ago, Tony wrote about expected effects of El Niño during June-August. Most of the El Niño-related changes that have been identified during past events are in the Southern Hemisphere during their winter; there are also significant effects in the tropics. These include warmer weather in some areas of South America, dry conditions in India, Indonesia, and Australia, and warm and dry conditions in Central America and the Caribbean. Also, more rain than average in part of Chile, and some cooler temperatures in part of Australia.
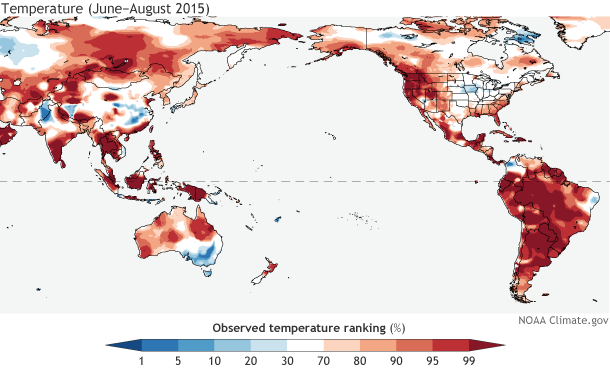
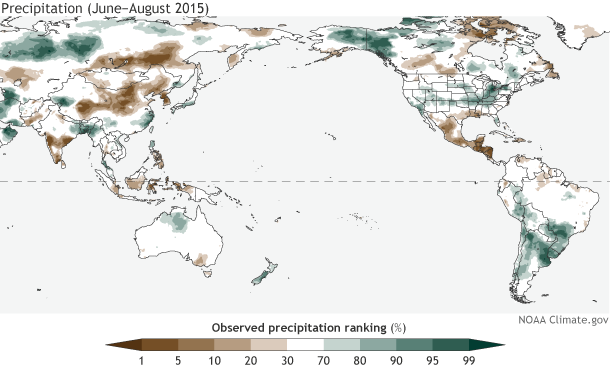
Observed temperature (upper map) and precipitation (lower) from June-August 2015. Observations are shown as their ranking in the period 1948-present: for example, a 90th percentile temperature means this June-August was warmer than 90% of the past June-August averages. Climate.gov figure from CPC data.
Much of South America did experience a very warm winter; in some areas, it was the warmest winter since these records began in 1948. Parts of Argentina, Uruguay, and Chile received a lot of rain during July-August. Central America and the Caribbean are very dry right now, with the June-August rainfall deficit just adding to a severe drought throughout the region. Also in line with expected conditions during El Niño, rainfall in some portions of India and Indonesia were well below average, and very few areas in this region saw more rain than average.
However, as we’ve said before (here and here, for example), El Niño impacts are not guaranteed, and an example of this is Australia’s recent winter, which was not nearly as dry as it has been during past El Niños.
What about the places that are directly affected by all that warm water? I heard the surface temperatures were more than 90°F in some places!
The warmer-than-average tropical Pacific waters can have a big impact on marine life. For example, there were large coral bleaching episodes (coral die-offs) during past El Niños, and it’s likely we’ll see a lot of coral bleaching this year. The warmer water can also affect fisheries, seaweed farms, ocean mammals, and birds.
What about the hurricane season? That’s supposed to be affected by El Niño, right?
El Niño can amp up the hurricane season in the Pacific, by providing lots of warm water to power the storms, and reducing the vertical shear (the change in wind speed/direction as you go up in the atmosphere). On the other hand, the shear is increased over the Atlantic, which makes it difficult for storms to form and strengthen. So far this year, the Pacific has been very active, and the Atlantic has been pretty quiet. There have been some unusual events in both basins recently – Tom wrote about them here and here.
Could El Niño die before this winter?
It’s unlikely. There is a large reservoir of warm water just below the surface of the tropical Pacific that will help to keep surface temperatures relatively high for at least a few more months, and the atmosphere is in sync with the ocean. However, the strength of the atmospheric response over the next few months is still to be determined. In 1997, the near-surface winds along the equatorial Pacific weakened so much that they reversed from normal, and blew from the west to the east, helping to reinforce the warm sea surface temperatures. We haven’t seen behavior like that yet, and it’s hard to predict right now if we will.
I keep hearing how the “Blob” (a large area of warm ocean temperatures off the West Coast of the U.S.) is going to be in a battle with this strong El Nino this winter. Which one will win?
El Nino and “the Blob” are not on an equal playing field, so the short answer is we expect El Niño to dominate the large-scale atmospheric pattern over the Pacific-North America this coming winter.
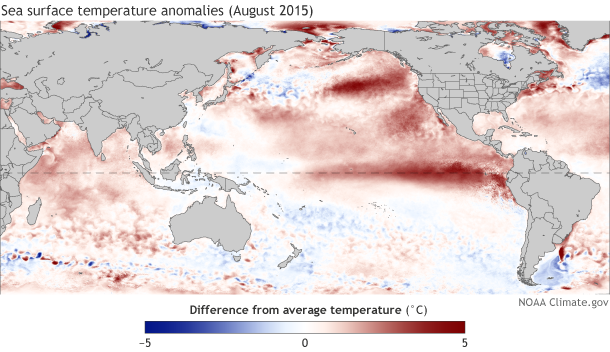
Sea surface temperatures during August compared to the 1981-2010 average. Climate.gov figure, based on data from NOAA View.
The Blob is not capable of changing the overlying atmospheric pattern in a significant way. In the Tropics, changes in ocean temperatures can easily lead to changes in the atmosphere above it. But outside of the Tropics, such as over the North Pacific Ocean, the physics are different, so ocean temperatures can’t effectively change the large-scale atmospheric flow or circulation pattern. The amount of heat in the Tropics is an enormous engine that drives rising motion and affects the whole globe’s circulation; the Blob is like a Fisher Price Power Wheel in comparison.
That said, the way that El Niño might affect water temperatures off the West Coast, or how those water temperatures might affect storms that are steered into the area by El Niño, is really hard to tell. As with any forecast, there are a lot of elements at play. However, El Niño is the dominant factor shaping the overall global picture for this winter.
Are you really naming El Niño?
No. That was a joke!
Comments
RRR?
Winter Climate Predictions
blob
Why in winter?
RE: Why in winter?
A very good question, with an answer too complex to answer in a blog site in a few minutes. Here are some hopefully helpful facts. The year-to-year difference in Nino3.4 SST is greatest in late fall and early winter, and least in late spring. During late spring the climatological average SST peaks, meaning that it has higher average SST than the other seasons, and during late summer to early winter the "cold tongue" develops and the average SST is lowest. So, each year, normally, there is a tendency toward El Nino in spring. During El Nino, the SST is just a bit warmer than average in spring when an event is developing, and as the climatological average declines during summer and fall, the actual SST fails to do so, so that the anomaly increases. So late fall is the time when the anomaly has the chance to be greatest. There is an upper limit on how warm the Nino3.4 SST can get (not anomaly, but actual SST) and in spring the climatological SST is closer to that limit than it is in the fall and early winter. So anomalies are more limited in spring than in late fall. When SST approaches the limit, cloudiness and rainfall increase, shutting off the sun and capping further increases, even though ENSO-related dynamics may proceed. I know this answer is not very satisfying, and you need to read some ENSO literature to learn more about the seasonality of the ENSO phenomenon.
Impacts of El Nino on New England winters.
RE: Impacts of El Nino on New England winters.
The link between New England and ENSO is not significant, so at this point t's difficult to say what's in store for New England this winter. Some El Nino winters have seen large snow totals (i.e. 2009/10) while others have seen very little (i.e. 1997/98).
Weather
re name it
re: Comparing to 1986-88' time period
El Nino - Total Anomolous Heat Content?
RE: El Nino - Total Anomolous Heat Content?
One may use the subsurface heat content as one measure of the El Nino strength, and this year (and even certain times during 2014) have been quite impressive. However, we creatures on land are most concerned about the climate effects, since they can interfere with (or sometimes help) our livelihoods and well being. Unless the heat from the subsurface anomalies affects the sea SURFACE temperature, the remote climate effects (teleconnections) are not triggered. This is why we care the most about the SST anomalies. On the other hand, the subsurface anomalies do represent and important potential for SST anomalies.
RE: RE: El Nino - Total Anomolous Heat Content?
RE: RE: RE: El Nino - Total Anomolous Heat Content?
It doesn't always work out that way. Just look at last year, when sub-surface temperatures were significantly warmer than average during the spring, and while there was some warming of the surface, it wasn't enough to jumpstart the atmosphere and El Nino never developed. But having warmer than normal waters below the surface at this point certainly provides us more confidence that this event will not end any time soon.
El Nino
RE: El Nino
Florida has a marked tendency toward wetter than normal, and cooler than normal this winter, due to the El Nino. See the Climate Prediction Center's forecast maps at the site http://www.cpc.ncep.noaa.gov/products/predictions/multi_season/13_seaso…
El nino
Commenting of color scale and ranking.
RE: Commenting of color scale and ranking.
You're right, the color scale is not the greatest for a precise indication of the sea surface temperature (SST) anomaly. It is meant as an approximation, to give you a general feel for where the departures are strong and where they are only weak. For a more precise figure, go to the Climate Prediction Center web site and click on the El Nino/La Nina item on the left side of the page, and there, if you dig around, you can find a more exact picture of the SST departures. About the strength, we often use the last one month to tell what the current strength is. For August alone, it was near or above 1.5C above normal, depending on which SST data set we use, and this suggests that the event has reached the strong category.
82-83 El Nino
RE: 82-83 El Nino
RE: RE: 82-83 El Nino
The 1982-83 event is usually considered to be the 2nd strongest El Nino since 1950, second only to 1997-98. But that is when we view the entire event, in retrospect. If we view only the spring and summer portion of the event, then 1982-83 is not strong enough to come in second place, because 1987-88 had a very warm spring and summer, since it was the second portion of a two-year event (1986-87 and 1987-88). If we wait a few months and then include this autumn in the data, the 1987-88 event will likely fade in its ranking, because it weakened fairly early toward the end of the year and during winter 1987-88. The big quesiton is where THIS CURRENT El Nino will end up ranking. Will it beat 1987-88 and even possibly 1982-83? Many of us think it may have a hard time beating 1997-98, but peak strength is hard to predict and even that is possible.
So much for skiing Whistler BC
How MJO and Rossby Waves
Hawaii
RE: Hawaii
Unfortunately, Hawaii is pretty small when looking at a map that includes North America. The Climate Predicton Center does issue monthly and seasonal forecasts for a few cities in Hawaii and they are available here:
http://www.cpc.ncep.noaa.gov/products/predictions/90day/fxhw40.html
Is an excellent article, I am
Awesome
mid latitude teleconnections
RE: mid latitude teleconnections
A good question. My somewhat simplistic thinking tells me that the eastward shift in the precipitation in the tropical Pacific would mean some eastward shift in the strongest portion of the ascending branch of the Hadley cell, and also an increase in the strengh of that branch due to the anomalously warm sea surface temperatures (SSTs) with their sensible and latent heating imparted to the atmosphere. That eastward displacement of maximum anomalous heating, and the excess heating itself across the eastern and central Pacific, would be expected to amplfy the Hadley circulation and also cause the north Pacific jet stream to be both stronger and extend farther eastward, as we know does occur during El Nino. This amplifcation and eastward elongation of the jet would be most apparent in the northern hemisphere during Nov - April (their winter) and in southern hemisphere during May - Oct (their winter), because the Hadley circulation is best defined when there is the largest equator vs subtropical atmospheric temperature difference. The largest differences occur during the winter season. An implication of the change during El Nino is that the subtropics would be drier than usual (e.g., northern Hawaii during winter), due to the stronger descending branch. As for the changes to the Ferrel cells, I know less and do not have an answer for you.
El Niño and PDO
RE: El Niño and PDO
The PDO would be expected to be positive during El Nino events, so it's not surprising that the PDO is currently positive and has been for better than the last year. At this point, it's premature to speculate that the negative phase has ended.
Skiing
RE: Skiing
ENSO often results in drier and warmer than normal conditions in the Pacific NW, likely resulting in less snow than normal.
Olaya guarnizo
el nino
RE: el nino
Hopefully you will get a healthy does of rain this winter due to the El Nino.
Hurricanes
RE: Hurricanes
Yes -- and during El Nino the general activity level for Atlantic hurricanes and tropical storms tends to be diminished compared to average. So, therefore, the chances of another year without a major landfalling hurricane should be greater than average.
Switch to La Nina
RE: Switch to La Nina
It's far too early to speculate on the demise of this event and what will follow, but certainly we've seen a number of El Nino episodes switch to La Nina by the following fall / winter. Certainly something to watch when we head into spring.
Hope you are right
El Nino Effects on the Galapagos Islands
Colorado Front Range
RE: Colorado Front Range
There is some indication that parts of eastern Colorado see more precipitation during the late fall and spring during El Nino years. This can be seen in the box and whisker plots shown here. The forecasts you reference however, include other tools, such as trends, model forecasts, and statistical tools.
http://www.cpc.ncep.noaa.gov/products/precip/CWlink/ENSO/box_whiskers/i…
Nino report
Ranking of El Niño
RE: Ranking of El Niño
The 1987 event peaked early with a maximum ONI value of 1.6, so at this time it's expected that 2015 will exceed that value. 1997 has the largest ONI value since 1950 (2.3). While it's possible that this event could exceed that value, at this time, it's not expected.
out of sinc
Can Northern Hemisphere destabiblise Elnino?
Comments have been disabled on this article