July 2018 ENSO Update: Dog days
The chance that El Niño conditions will be in place across the tropical Pacific by the fall is about 65%, and close to 70% by the winter, continuing the El Niño Watch from last month. Here in the U.S., with sultry weather from coast to coast, it’s hard to think about winter right now…but that’s our job! After a trip through the tropical Pacific, we’ll get into what El Niño could mean for global weather and climate this winter.
A splash in the pool
The tropical Pacific is still well within neutral limits. The temperature of the ocean surface in the Niño3.4 region has edged above average, with June 2018 coming in about 0.11 degrees Celsius above the long-term average, based on our best-quality data set. Most climate models predict that the Niño3.4 region temperatures will reach the El Niño threshold (0.5°C above the long-term average) by the fall.
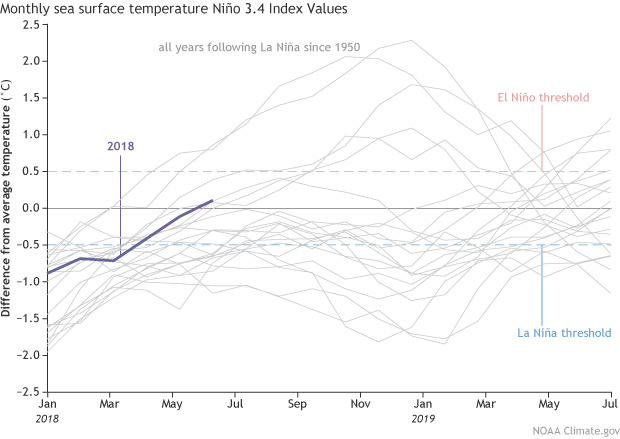
Monthly sea surface temperature in the Niño 3.4 region of the tropical Pacific for 2018 (purple line) and all other years since 1950 that started from La Niña conditions. In all but one of those years, a positive temperature anomaly by this point in the summer foreshadowed El Niño by winter. Climate.gov graph based on ERSSTv5 temperature data.
Much of the rest of the equatorial Pacific is warmer than average now, as well, with only the Niño1+2 region (the farthest east region, next to the coast of South America) still cooler than average.
The temperature of the water below the surface of the Pacific is elevated, too. The downwelling Kelvin wave that was initiated a few months ago has sloshed to the east across the Pacific, bringing warmer waters toward the surface. It’s likely the surface will continue to warm over the next few months, helping to support the forecast for El Niño’s development.
Departure from average of the surface and subsurface tropical Pacific sea temperature averaged over 5-day periods starting in early June 2018. The vertical axis is depth below the surface (meters) and the horizontal axis is longitude, from the western to eastern tropical Pacific. This cross-section is right along the equator. Climate.gov figure from CPC data.
Fans & sprinklers
The atmosphere over the tropical Pacific is demonstrably neutral right now. Cloud cover and rain over the central Pacific are still reduced compared to average, a hold-over from this past winter’s La Niña. On the other hand, atmospheric conditions over Indonesia have returned to near-average.
Both the Southern Oscillation Index and the Equatorial Southern Oscillation Index were near zero during June, reflecting neutral conditions. These indexes compare the surface air pressure in the central-eastern Pacific to the pressure in the western Pacific, a useful metric for the Walker circulation.
If the pressure in the eastern Pacific is relatively lower (more rising air than average, resulting from warmer-than-average sea surface temps) and the pressure to the west is relatively higher (less rising air, due to cooler waters), it can be another indication the Walker circulation has weakened, representing the atmospheric component of El Niño. Don’t forget—the “SO” part of ENSO stands for “Southern Oscillation.”
We’ll keep an eye on these indexes and the other indicators of the atmospheric component of ENSO while we’re sweating it out over the summer and into the fall. El Niño is a coupled system, meaning it requires both the Niño3.4 region to be more than 0.5°C above average and for the atmosphere to respond to those warmer-than-average waters. When both conditions are met, and expected to continue for several months, El Niño conditions will have arrived.
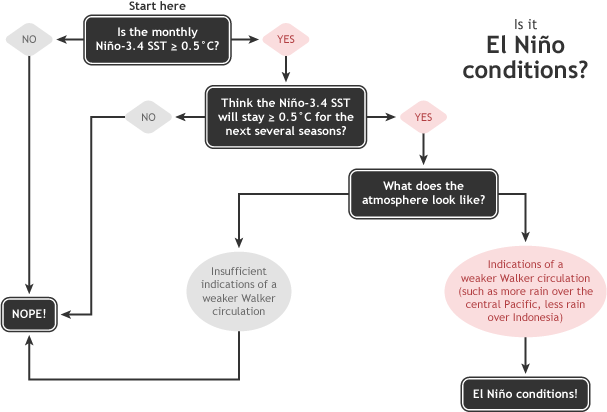
Summary of NOAA decision process in determining El Niño conditions. NOAA Climate.gov drawing by Glen Becker and Fiona Martin.
Dreaming of winter
So… who cares? Why do we even spend so much time and energy on El Niño? Because, to quote my blog-brother Tom, it’s a seasonal forecaster’s best friend. When the normal location and intensity of thunderstorms and winds in the Pacific basin are disturbed, it’s like a cannonballer sending waves through a pool: the effects are felt around the globe. Because El Niño and La Niña are generally predictable months in advance, forecasting an El Niño during the winter means we can often anticipate certain U.S. weather patterns during the winter.
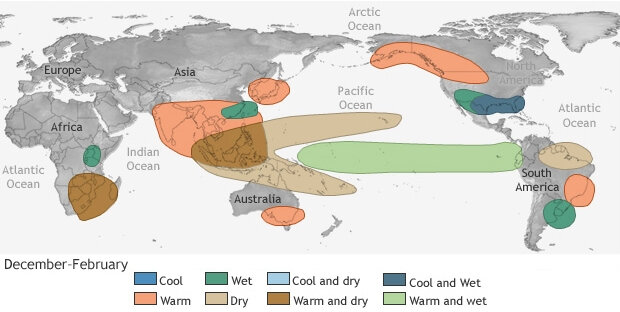
Typical rainfall and temperature patterns during El Niño events. Such teleconnections are likely during El Niño events, but not certain. Map by climate.gov.
Of course, the atmosphere is a huge, chaotic system, and we don’t see every expected effect every time El Niño shows up. More than half of the events since 1950 have some kind of wet signal over California, for example, but it can be confined to the southern part of the state in some events and shifted northward during others. (Here’s the corresponding image for temperature.)
Also, El Niño is never the only player on the field (check out the index page, under “Posts about things other than ENSO”). That said, a forecast for an El Niño winter can give us an early glimpse of our winter weather, even while we’re sweltering under summer’s heat domes.
Comments
Nice Blog. And good news, too!
Fingers crossed!
Comments have been disabled on this article