April 2017 ENSO update: Conflicting signals from the tropical Pacific Ocean
The tropical Pacific Ocean has been giving mixed signals recently, making a forecaster’s job even more difficult! In short, many of the computer models we use are predicting the development of El Niño over the next several months, but current conditions in the tropical Pacific aren’t showing many of the elements we’d expect ahead of a developing El Niño.
We’ve had neutral ENSO conditions since January, and forecasters predict that continued neutral is the most likely scenario through at least June. By September, chances of El Niño rise to about 50%, a slight edge over neutral (~40% chance) or La Niña (~10% chance).
What are forecasters seeing now?
We rely on prediction models because they provide the most likely evolution of the ENSO system better than we can compute on our own by eyeballing maps and charts and analyzing what has happened in the past under similar conditions.
Right now, many climate forecast models do predict the development of a full-fledged El Niño during this summer or fall. It’s likely that these models are acting on the much warmer-than-average waters near the coast of South America—the “Coastal El Niño” that I’ll get to a little bit later in this post. Predictions for the Niño3.4 region in the east-central Pacific, shown in the figure below, show chances for El Niño ramping up over the next year.
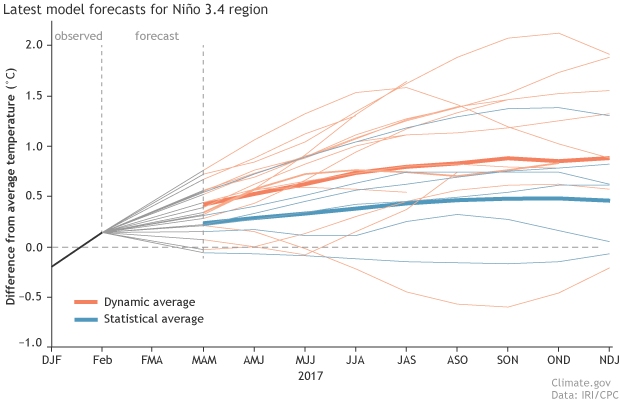
Climate model forecasts for the Niño3.4 Index, from the IRI/CPC Prediction Plume. Orange lines indicate the dynamical models and blue lines show the statistical models, with thicker lines depicting the average of the models. Niño3.4 values in excess of +0.5C are reflective of El Niño conditions. Image modified by NOAA Climate.gov.
While nearly all of the available dynamical models are predicting an El Niño, only about half of the statistical models are, and those that do are predicting a weaker event than the average of the dynamical models. Statistical models are based on previous events, and right now the tropical Pacific does not look much like it has before past El Niños.
As we have discussed in the past on this blog, El Niño sets in when the ocean and the atmosphere show coupled behavior—that is, when a stronger link develops between the warming waters in the central and eastern tropical Pacific, and the slowing down of the Walker circulation, in which the westward-blowing trade winds near the surface weaken and the eastward-blowing upper level winds also weaken.
Right now, the tropical Pacific Ocean is split. There is warmth in the eastern Pacific Ocean (the Coastal El Niño—I’ll get to that, I promise). But the western and central Pacific Ocean actually look more reflective of cool, La Niña-like conditions! This is indicated by drier conditions near the Date Line and wetter conditions over Indonesia.
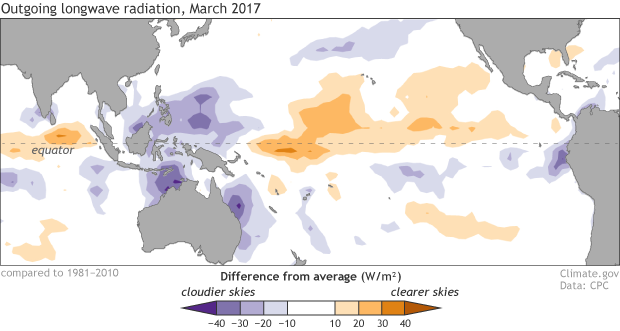
Places that were more (purple) or less (orange) cloudy than the 1981-2010 average during March 2017, based on satellite observations of outgoing longwave radiation (heat). Thick clouds block heat from radiating out to space, so less radiation equals more clouds, and more radiation equals clearer skies. Climate.gov map from CPC OLR data.
Also, surface winds over the west-central Pacific have been blowing stronger than average (a stronger Walker circulation, more like La Niña). Meanwhile, the surface temperatures in the central Pacific are cooler than average, also more like La Niña than El Niño. Even the sub-surface ocean temperatures are below average in the central Pacific over the past month. As Aaron pointed out, in advance of an El Niño, we would want to see heat content that is above average.
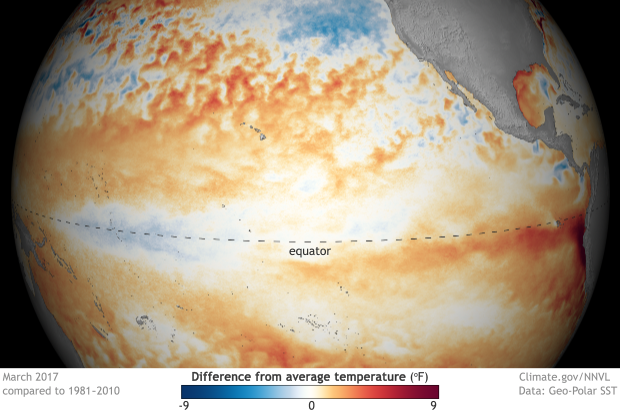
Sea surface temperature in March 2017 compared to the 1981-2010 average. Cooler-than-average SSTs are present in the central equatorial Pacific and warmer-than-average SSTs are present over the eastern equatorial Pacific. NOAA Climate.gov map, based on GEO-Polar data.
Finally! The coastal El Niño!
During the last two months, strong warming developed in the eastern tropical Pacific Ocean, hugging the western coast of South America. Emily noted back in early February that the Peruvians designated this abnormal warmth as a “coastal El Niño” and it has resulted in unusually heavy rainfall along the coast of Ecuador and northern Peru, rivaling the major El Niño events in 1997-98 and 1982-83.
This local event is different from the El Niño-Southern Oscillation (ENSO) we’ve come to know and love, which spans the width of the Pacific Ocean basin. Coastal events tend to arise during the February-April period because sea surface temperatures are typically near the warmest of the year. Heavy rainfall starts when surface temperatures exceed roughly 28˚C (82°F). Ken Takahashi (Instituto Geofisico del Peru) provided the data below showing this coastal event over the past month.
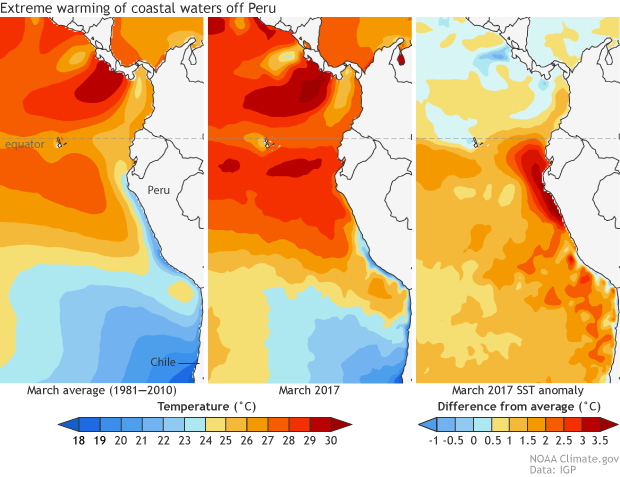
Average of sea surface temperatures (SST) in the eastern Pacific during March from 1981-2010 (left panel), for March 2017 (middle panel), and for the difference between the left and middle panels, showing the SST anomaly, or departure from average, during March 2017 (right panel). Climate.gov map from IGP using UKMet OSTIA data.
Does a coastal El Niño often turn into ENSO events?
Interestingly, it was Peruvian fishermen who first gave “El Niño” its name in the late 1800s, when they noted unusual oceanic warmth near their coast. Later researchers, most notably Jacob Bjerknes in 1969, realized that the El Niño—the cycle in ocean temperatures—was often connected to the atmosphere above it, the “Southern Oscillation.” The latter is more far-flung, and reflects the change in the tropical Pacific circulation (winds, convection) that overlies changes in the ocean. The basin-wide El Niño-Southern Oscillation (ENSO) phenomenon was corroborated in the early 1980s, when detailed information became available with the advent of satellites and advanced monitoring systems like the Tropical Atmosphere Ocean (TAO) buoy array.
Although basin-wide El Niño events were once thought to originate as coastal El Niño events (footnote 1), we’ve since learned that this is not always the case. Coastal warming sometimes precedes strong coupling between the ocean and atmosphere (ENSO events) that span the entire tropical Pacific Ocean, but not always.
In this war of East versus West, which will eventually win out?
Most of the dynamical models favor the eastern pattern “winning” with an expansion of the coastal El Niño into a full-blown El Niño event. Mind you, only once since 1950 have we seen a sequence of El Niño, La Niña, El Niño during three consecutive years—in 1963-66.
While many models have been quite persistent over the last few months in their predictions for El Niño, they carry fairly wide uncertainty envelopes that translate into tempered probabilities for El Niño. Plus, we are still in a period of less skillful forecasts associated with the spring ENSO predictability barrier. Given this low model skill in the past at this time of year, and the conflict between the warm eastern Pacific and the relatively cool western Pacific, forecasters find that the odds of development of El Niño in the next six months, while elevated, are not quite at the threshold for an El Niño Watch.
Footnotes
(1) Research in the early 1980s, based on several earlier El Niño events, hypothesized that the basin-wide El Niño often begins as a coastal El Niño that expands westward (Rasmusson and Carpenter 1983). However, El Niño events subsequent to that study turned out just as often to originate differently, such as from the central Pacific. So a coastal El Niño is no guarantee that a basin-wide El Niño is on the way.
References
Bjerknes 1969: Atmospheric teleconnections from the equatorial pacific. J. Phys. Oceanog., 97, 163-172.
Rassmusson, E. M., and T. H. Carpenter, 1982: variations in tropical sea surface temperature and suface wind fields associated with the Southern Oscillation/El Niño. Mon. Wea. Rev., 110, 354-384.
Comments
ENSO Facts
Predictability
RE: Predictability
The greatest remote impacts of El Nino occur during the winter in each hemisphere: December-February in the Northern Hemisphere, and June-August in the Southern Hemisphere. Because El Nino peaks in the November-December timeframe, the impacts tend to be greater in the Northern Hemisphere. By "remote impacts", I mean areas that are far away from the El Nino-related warm waters of the central and eastern Pacific. However, since Peru is right next to those warm waters, it can receive a direct effect of increased storms.
Monsoons in India
The coastal El Niño?
Thanks
RE: Thanks
Thanks for great link
forecasting
RE: forecasting
Prediction of the long-term trend (aka global warming) is different from prediction of climate variability, meaning shorter-term changes, including El Nino. The two are closely linked, with the trend affecting variability, but our understanding that the climate is warming due to increased greenhouse gases from fossil fuel burning is different from our ability to exactly forecast how the climate will behave over the next few months. The former is well established, while the latter is still a developing science. That said, over time, probability forecasts for climate variability can be successful--check out Michelle's post on climate predictions for more about the "long game."
Forecasting
Climatic condition
Comments have been disabled on this article