March 2019 El Niño Update: Think spring
Our much-delayed weak El Niño continued into March, and forecasters give it an 80% chance to continue through the spring, with a 60% chance of continuation through the summer.
Spring showers
As you may remember from February’s update, the atmosphere finally started showing signs of a response to the warmer-than-average sea surface temperatures in the central tropical Pacific, leading the forecast team to issue an El Niño Advisory. More rain and clouds than average formed over the warmer waters of the central Pacific, less over Indonesia, and near-surface winds in the central Pacific slowed. These patterns continued over the past few weeks, with the dry-Indonesia/rainy-central-Pacific pattern showing up clearly in the cloud patterns.
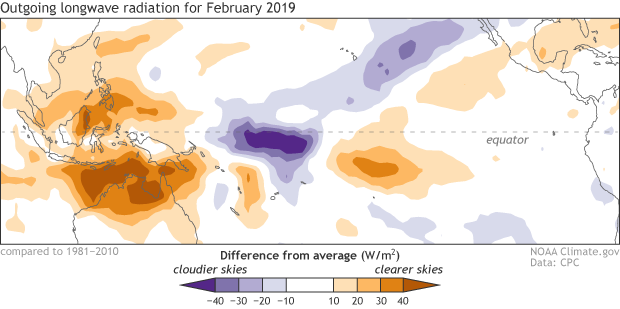
Places that were more (purple) or less (orange) cloudy than the 1981-2010 average during February 2019, based on satellite observations of outgoing longwave radiation (heat). Thick clouds block heat from radiating out to space, so less radiation equals more clouds, and more radiation equals clearer skies. Climate.gov map from CPC OLR data.
(For a really cool investigation into why the atmospheric response may have been delayed this year, be sure to check out the recent post by Nat Johnson, P.I.)
The strength of the atmospheric component of ENSO, the Southern Oscillation, is measured using two different indexes. While they use different specific locations, both indexes compare the atmospheric pressure in the far western Pacific to that in the east-central Pacific. When these indexes are negative, it means there is less rising air than average (higher pressure) in the west, and more rising air (lower pressure) in the east. Both the Southern Oscillation Index and the Equatorial Southern Oscillation Index were -1.4 during February.
Spring breeze
As I mentioned, the atmospheric response, a weakening of the Walker circulation, includes a slowing of the trade winds, the near-surface winds that usually blow consistently from the east to the west across the Pacific near the equator.
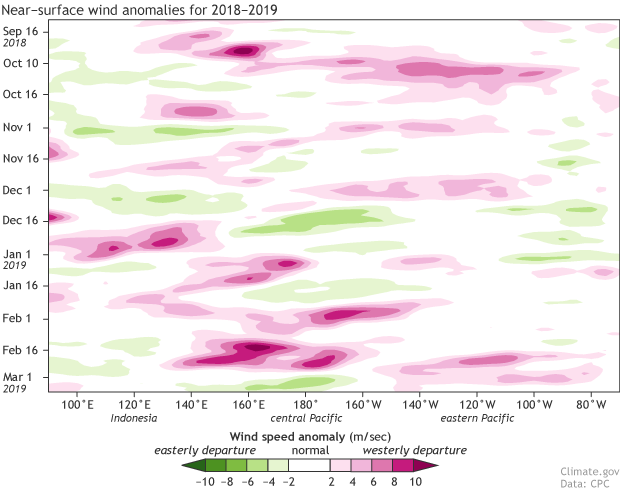
Near-surface wind anomalies over the tropical Pacific (5°N-5°S) during 2018, starting at the top in September 2018 and ending in early March 2019 at the bottom. Each row in this type of image is the departure from average (1981-2010) at that time. Pink areas show weaker-than-average trade winds, and green stronger. NOAA Climate.gov image, based on data provided by the Climate Prediction Center.
During most of February, the winds near the surface of the central Pacific were substantially slower than normal. When the trade winds slow, they allow the surface waters to warm, and can sometimes kick off or enhance a downwelling Kelvin wave, a large area of warm water that slides from the west to the east under the surface. Likely in part due to the slowing winds, sea surface temperatures in the equatorial Pacific Niño3.4 monitoring region increased to ~1°C warmer than average during February, reversing some cooling that had taken place in January.
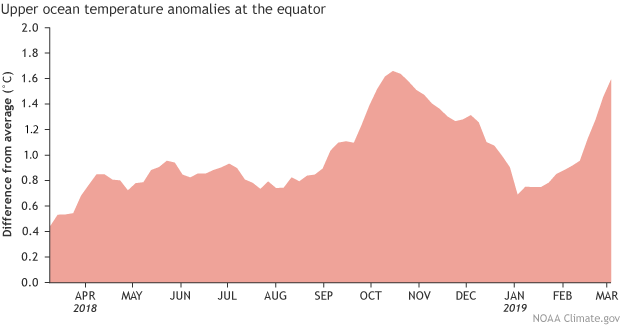
Area-averaged upper-ocean heat content anomaly (°C) in the equatorial Pacific (5°N-5°S, 180º-100ºW). The heat content anomaly is computed as the departure from the 1981-2010 base period pentad (5-day) means. Heat content has been elevated for the last 12 months, but recently increased again. Climate.gov figure from CPC data.
The amount of warmer-than-average water below the surface of the tropical Pacific also increased substantially in February, after dropping over the past few months. As the current downwelling Kelvin wave continues to move to the east and gradually rise, it will provide warmth to the surface—one of the sources of confidence in forecasters’ predictions that El Niño conditions will continue through the spring.
Spring training
The state of the tropical Pacific in early 2019 has some eerie similarities to that of early 2015. After several months of warmer-than-average sea surface temperatures, the atmosphere responded with weak El Niño conditions, similar to 2015. And, a downwelling Kelvin wave is present, as in 2015. Many climate models are predicting that sea surface temperatures will remain elevated through the year.
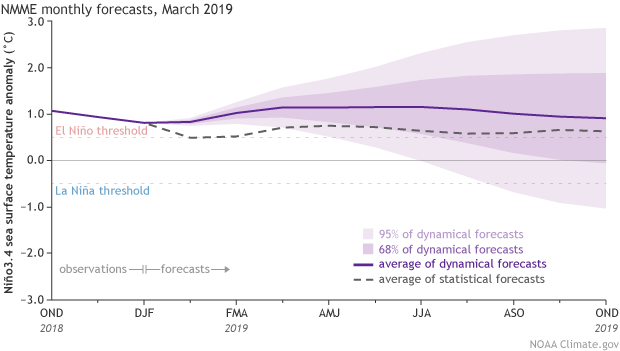
Climate model forecasts for the Niño3.4 Index. Dynamical model data (purple line) from the North American Multi-Model Ensemble (NMME): darker purple envelope shows the range of 68% of all model forecasts; lighter purple shows the range of 95% of all model forecasts. Statistical model data (dashed line) from CPC’s Consolidated SST Forecasts. NOAA Climate.gov image from CPC data.
So are we in for another 2015-style strong El Niño? Even with now and then having so much in common, it’s far too soon to tell. Climate models are notoriously unreliable when making predictions in March and April, when ENSO is often in transition. As this graph of climate model forecasts shows, the range of potential outcomes is huge, and includes everything from a moderate La Niña through a stronger El Niño. This huge range tells us that the climate models do not have much agreement about what will happen next fall.
Also, wind patterns and heat content in March are not very powerful predictors of fall El Niño patterns. While it’s likely that the current weak El Niño conditions will continue through the summer, as Michelle said in 2015, “there are still plenty of innings left to play.” Hopefully, we’ll have a clearer picture of next fall after the spring predictability barrier is behind us.
Spring green
What do El Niño conditions through the spring portend for global weather patterns? El Niño’s effect on global circulation is weaker in the spring than in winter, but still detectable. Historical global temperature and rain patterns during El Niño in the spring show less rain than average over a lot of the tropics, for example.
Weak El Niño conditions mean these impacts may be less consistent than during strong El Niño. Check the Climate Prediction Center for an outlook on US seasonal patterns. El Niño conditions through the summer can affect the hurricane season, too—the Climate Prediction Center’s hurricane season outlook will be issued in May, so stay tuned!
Comments
El-Nino
RE: El-Nino
That's a great question as El Nino can certainly impact the Indian Monsoon, although things are a bit more complicated than that. Please check out this past ENSO blog post to find out more.
We've been getting far less
So impressive!...
RE: So impressive!...
Thank you!
El Nino 2019 Southwest Africa impac
El Nino 2019 is clearly explined.
climate change and El Nino
RE: climate change and El Nino
Great question! I recommend reading some of our past posts on the topic.
https://www.climate.gov/news-features/blogs/enso/enso-climate-change-headache
https://www.climate.gov/news-features/blogs/enso/climate-change-and-enso-take-2
https://www.climate.gov/news-features/blogs/enso/challenges-enso-today%E2%80%99s-climate-models
Comments have been disabled on this article