April 2019 El Niño update: You are here
The Great Puny El Niño of 2018–19 continued through March, and forecasters predict it will likely remain through the summer and possibly continue into the fall. The tropical Pacific Ocean shows El Niño’s fingerprint clearly, with warmer-than-average sea surface temperatures stretching across the equator.
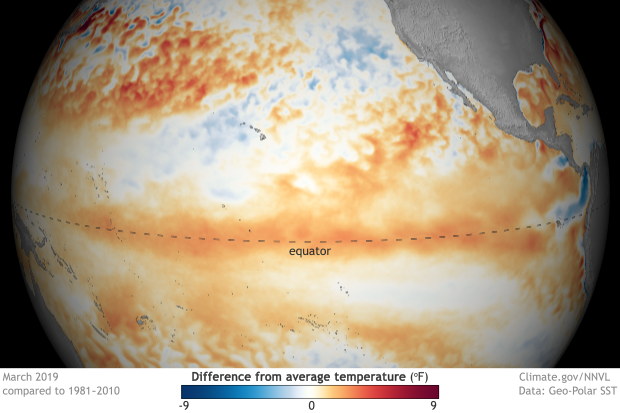
March 2019 sea surface temperature departure from the 1981-2010 average. Graphic by climate.gov; data from NOAA’s Environmental Visualization Lab.
Birds fly here
The El Niño atmospheric response was also apparent in March, with continued greater-than-average cloudiness and rain near the International Date Line. This is the weakened Walker Circulation pattern, due to more rising air than average over the central Pacific as the warmth of the ocean is transferred to the air above. Both the regular-flavor Southern Oscillation Index and the Equatorial Southern Oscillation Index were negative during March (-0.3 and -1.2, respectively), showing this continued atmospheric response.
We are also interested in the near-surface wind patterns, another critical component of the Walker Circulation, because these winds are how the atmosphere communicates with the ocean. The trade winds normally blow relatively steadily from east to west along the equator, keeping warm water piled up near Indonesia. When they are weaker than average, the ocean surface can warm, and the pile of warm water can begin to slosh to the east. During March, the trades were weakened, but this pattern was confined to a fairly small area of the western Pacific. (Remember this for a bit later when I get into the forecast.)
Fish swim here
El Niño’s signature warmer-than-average sea surface temperatures were solidly evident in March, with a monthly average of 0.9°C above average from ERSSTv5, our longest observation dataset. The January–March 3-month average from ERSSTv5, what we call the Oceanic Niño Index, was 0.8, marking the fifth consecutive, overlapping 3-month period above the El Niño threshold (0.5°C above average).
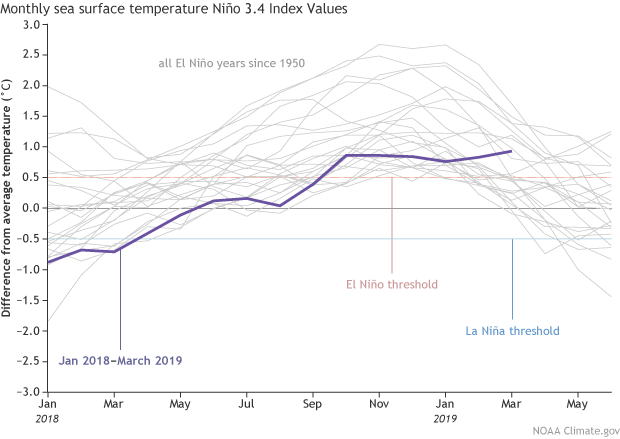
Monthly sea surface temperature in the Niño 3.4 region of the tropical Pacific for 2018–19 (purple line) and all other El Niño years since 1950. Climate.gov graph based on ERSSTv5 temperature data.
The purple line above is noticeably flat, without the gradual increase, peak, and decline that so many other El Niño events have exhibited. This flatness isn’t unusual behavior for a weak El Niño, however, as other events, including 1977–78, 1978–79, and 2004–05, show.
Future you lives here
What is unusual is the model forecast for continued weak El Niño through the summer, with the tropical Pacific sea surface temperature expected to stay a bit above the El Niño threshold. This is a pattern that we haven’t seen in the (admittedly short) 1950–present historical record.
Also, forecasters think there’s about a 50-55% probability that El Niño will continue into the fall. As we’ve discussed before, the spring predictability barrier means it’s difficult for climate models to make successful predictions during March, April, and May, a time of year when ENSO (El Niño/Southern Oscillation, the entire El Niño and La Niña system) events are usually decaying and changing phase. This springtime indecisiveness partially explains the moderate probabilities that forecasters estimate for El Niño continuing into the fall.
The amount of warmer-than-average water between the surface and about 300 meters below the surface was elevated during March, as a downwelling Kelvin wave continued to move eastward under the surface of the equatorial Pacific. As this blob of warm water gradually rises, it will provide a source of warm water to the surface, helping to keep temperatures elevated through the next few months, and helping support the forecast through the spring and summer.
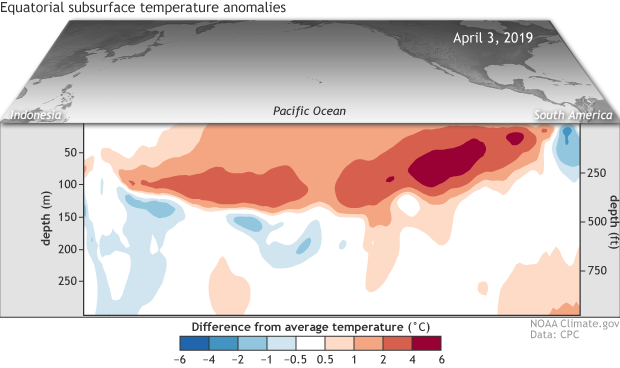
Departure from average of the surface and subsurface tropical Pacific sea temperature averaged over the 5-day period centered on April 3rd. The vertical axis is depth below the surface (meters) and the horizontal axis is longitude, from the western to eastern tropical Pacific. This cross-section is right along the equator. Climate.gov figure from CPC data.
The subsurface temperature in March, as well as the near-surface winds (see “birds” above), have some correspondence to ENSO conditions in the subsequent fall/winter, but not a super strong relationship. This 2015 post by Michelle gets into that relationship, showing that there has been a pretty wide range of outcomes in the historical record. (That post uses an older sea surface temperature dataset, but the results would be similar using the newer one.) So while these conditions are factored in to the forecast for the later part of the year, they’re not a huge source of confidence. Plus, the wind anomalies in the western Pacific are pretty darn feeble, which does not elicit comparisons with the evolution leading up to the major 2015-16 El Niño.
Since ENSO interacts with the hurricane season, I’ll be interested to see how the forecast for continued weak El Niño affects the Climate Prediction Center’s hurricane outlook, issued later next month. For now, stay tuned, and we’ll keep you updated on all things ENSO!
Comments
Figures update
RE: Figures update
The nice thing about linear regression is that it (the red line) doesn't change much w/ the addition of new data. The general principles still hold. Right now the low level winds look like this:
https://www.cpc.ncep.noaa.gov/products/analysis_monitoring/enso_update/uv850-30d.gif
And the heat content looks like this:
https://www.cpc.ncep.noaa.gov/products/analysis_monitoring/ocean/weeklyenso_clim_81-10/wkteq_xz.gif
Which are some reasons we're not, at this point, expecting a particularly significant El Nino if it were to continue (not like 2015-16 which was a top three event).
RE: RE: Figures update
RE: RE: RE: Figures update
Yes, we are specifically talking about 2019 to early 2020. And yes, that is about as far out as we can see with reasonable skill. At this point, we cannot rule out anything for later in 2020. However, I will mention that we have not experienced a three-year El Nino in the historical record, so if we continue to experience El Nino conditions through fall 2019 and early winter 2020, then it would seem to be very unlikely that we would experience an El Nino like 2015/16 the following year.
RE: RE: Figures update
RE: RE: RE: Figures update
That region is too far north to be directly affected by the Walker circulation. Most of the ocean surface off California seems to have warmer than average temperatures (see, for example, here), so I am guessing that the cooler waters reflect local wind conditions and the ocean response. On the larger scale, the forecast models generally have been favoring warmer than average conditions along the California coast, so I would not rule out a reversal of the cooler conditions you describe.
About El Niño
RE: About El Niño
ENSO
RE: ENSO
Much appreciated! Emily does do an awesome job w/ these top of the month posts, that's for sure.
April 2019 El Nino update
RE: April 2019 El Nino update
The warming impacts from downwelling Kelvin waves are not instantaneous so we can track their journey across the Pacific Ocean. From there, we can time when its influence might begin to show up in the metrics we use to measure ENSO. A lack of upwelling and a weakening of the trade winds can also cause surface warming too and also can be monitored through buoys in realtime. Oftentimes, you might see both occurring at the same time.
What lurks beneath this time?
RE: What lurks beneath this time?
Haha! We'll see if we can get the graphics folks to help us out with a whale shark graphic next time.
Re: This (April 2019) Article
Your ENSO blogs
RE: Your ENSO blogs
Thanks Michael,
Previously on the blog, guest author Dr. Kim Cobb wrote all about Kiritimati Island and the impact warmer than average ocean waters have had on corals.
https://www.climate.gov/news-features/blogs/enso/bittersweet-victory-el-ni%C3%B1o-chaser
RE: RE: Your ENSO blogs
RE: RE: RE: Your ENSO blogs
This topic is beyond my expertise, but I will just note that the destruction from 2014-2017 was widespread. This article provides a little more context on the scope of the impacts on coral.
April 2019 El Niño update
RE: April 2019 El Niño update
Hi Lachlan,
To clarify, I meant that the forecast pattern, which predicts the Nino3.4 SST will remain between 0.5 and 1 degree above average through next winter, is not something we've seen before. You're right that the current pattern resembles the first part of 1986-88, through spring 1987, when the SST anomaly started to increase, eventually peaking at 1.7 degrees above average in July-September.
RE: April 2019 El Niño update
What are the impacts going to
RE: What are the impacts going to
We're all curious to see how ENSO will be factored in to the hurricane season outlook; generally, El Nino leads to fewer Atlantic hurricanes, but there are a lot of factors taken into consideration in the outlook. It will be released this month, so stay tuned to https://www.cpc.ncep.noaa.gov/products/outlooks/hurricane.shtml .
may grey june gloom
RE: may grey june gloom
Generally, we would expect fewer May Gray/June Gloom days with an El Nino episode, but I would not expect a strong impact with the weak episode that we currently have.
Effects of Weak El Nino on Summer Temperatures
RE: Effects of Weak El Nino on Summer Temperatures
El Nino doesn't play a big role in summer time temperatures in the Pacific Northwest. At this time, the current CPC outlook does favor above average temperatures, with long term trends playing a significant role in the outlook.
Rain in dominican republic North west- El Nino
RE: Rain in dominican republic North west- El Nino
During the wet season (May-Nov) El Nino's impact tends to be drier than average in the DR. A great webpage for seeing the probability for below/near/above precipitation is located here courtesy of the IRI and suggests 2019 may lean dry:
https://iri.columbia.edu/our-expertise/climate/forecasts/seasonal-climate-forecasts/
At this point it's too early to say how 2020 will be impacted based on the state of ENSO.
El Nino and La Nina
RE: El Nino and La Nina
While not zero, odds of a late year La Nina are about 10%, so sure it could happen, but it's clearly not the most likely outcome.
el nino
El Nino
RE: El Nino
Atmospheric rivers are driven by various weather and climate phenomena and are not always related to ENSO. El Nino can help increase the occurrence of them, but that is, by no means, guaranteed. Our ENSO outlooks are probabilistic and each month we offer updated chances for an El Nino event, which we also discuss here on the ENSO blog. https://www.cpc.ncep.noaa.gov/products/analysis_monitoring/enso_advisory/ensodisc.shtml
Comments have been disabled on this article