La Niña, did you orchestrate this?
This is a guest post by Dr. Ángel G. Muñoz who works at the Atmospheric and Oceanic Sciences Program at Princeton University and NOAA Geophysical Fluid Dynamics Laboratory. He focuses on the study of climate extremes and regional climate variability, predictability and model diagnostics, with an emphasis on Latin America and the Caribbean.
Imagine an orchestra playing your favorite concerto or film score, each instrument contributing its share to the entire piece. Sometimes one of them seems to lead the others, to become soon after just another thread in the musical tapestry, no more important than any other instrument.
Like in concertos, sometimes ENSO (El Niño-Southern Oscillation, as climate scientists call the El Niño & La Niña phenomenon) seems to lead what we could call the “climate symphony,” especially during strong events like the 1988-89 La Niña, or the 1997-98 and 2015-16 Los Niños (the plural of “El Niño” in Spanish).
At other times, like the present weak La Niña, the competing effects of other climate phenomena can be so important that they modify the typical ENSO rainfall patterns in several parts of the world. If we are listening for a moment of dissonance in the climate concerto, let’s replay the score of South America’s rainfall last month, for example.
A Latin American La Niña symphony?
During a La Niña event, we expect above-normal rainfall in northern South America and below-normal rainfall in southeastern South America. And certainly, during December 2016, regions of Colombia and Venezuela, and northern Guyana and Suriname received above-normal precipitation (see the figure below). Although rain was abundant in the low-level plains of coastal Guyana, where 80% of its population lives, the other countries did not observe extreme rainfall events of importance. For example, Luis Alfonzo López, from Colombia’s National Met Service (IDEAM), recently told me that although they received above-normal precipitation in several places, the totals were not extreme.
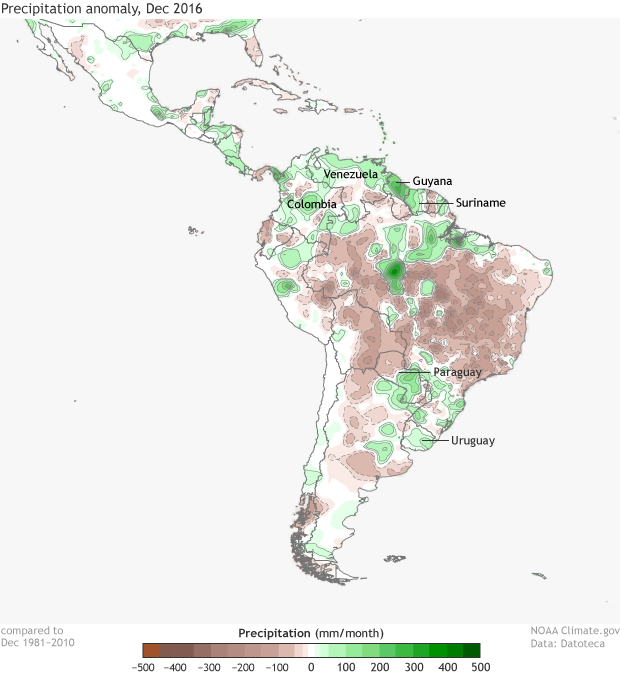
Rainfall anomalies (mm per month) observed in December 2016; green colors correspond to above-normal rainfall (opposite for brown colors). Normal is computed with respect to the period 1981-2010.
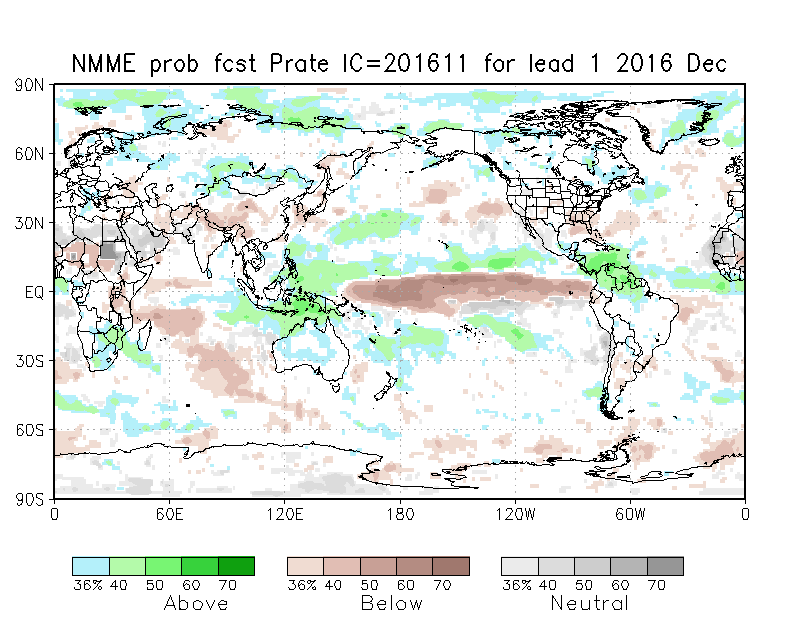
The situation was a bit different in southeastern South America, especially in the southern half of Paraguay and most of Uruguay, where above-normal rainfall conditions were observed—the opposite of what we’d expect during La Niña. Max Pastén, who works at the National Met Service of Paraguay (DINAC-DMH), confirmed that they did have extreme rainfall events that were not expected in this season, and especially during a La Niña. Indeed, although our forecast models from the North American Multi-Model Ensemble (NMME) correctly suggested above-normal rainfall for northern South America for December 2016, they predicted the typical La Niña-like below-normal precipitation for southeastern South America.
Competing instruments
Is it possible that other climate patterns stood in opposition, or in the world of music, counterpointed (footnote 1), the La Niña signal in southeastern South America? Keep in mind that it is sometimes challenging to find ENSO’s thumbprint in a single month (December 2016) of climate anomalies because ENSO is a seasonal (3-month average) climate phenomenon, although its signal can still be in the background.
When analyzing a month of data or less, sometimes a primary suspect for causing unusual climate conditions is the Madden-Julian Oscillation (MJO), an eastward-propagating area of storminess that modifies rainfall patterns as it travels around the world, completing a loop in 30-60 days (see Wheeler and Hendon, 2004). If, as I do, you tend to think that ENSO has two different faces (El Niño and La Niña), you might think that MJO has eight! Its eight different phases have distinctive rainfall signatures that you can see in this animation.
A quick analysis shows that Phase 6 was the most frequent one in December 2016; this phase is normally associated with below-normal precipitation for most of Uruguay and above-normal rainfall in parts of Paraguay and northern Argentina (see the figure below). Even though Phase 6 was the most common, the MJO strength was very weak or inactive in December. So we can rule out the MJO as a primary suspect in contributing to the precipitation in this region—its weakness is its alibi.
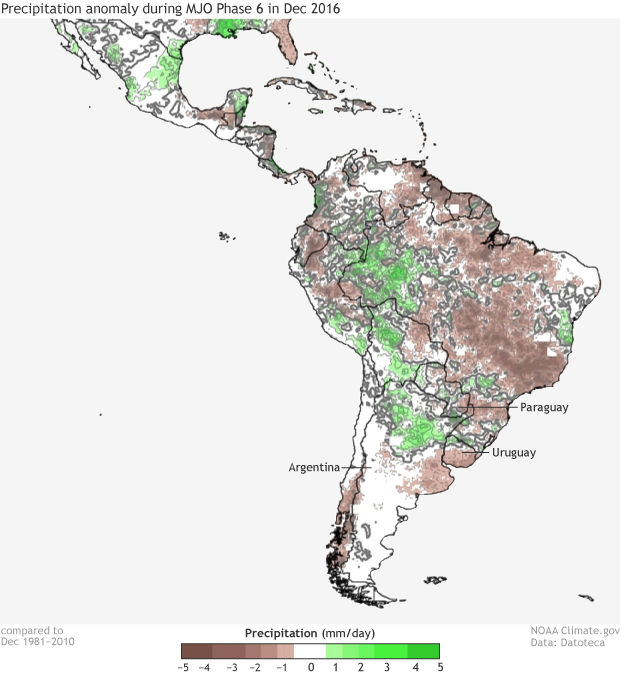
Rainfall anomalies (in mm per day) associated with Phase 6 of MJO, based on historical observations. Colors and reference period are as in the first figure above.
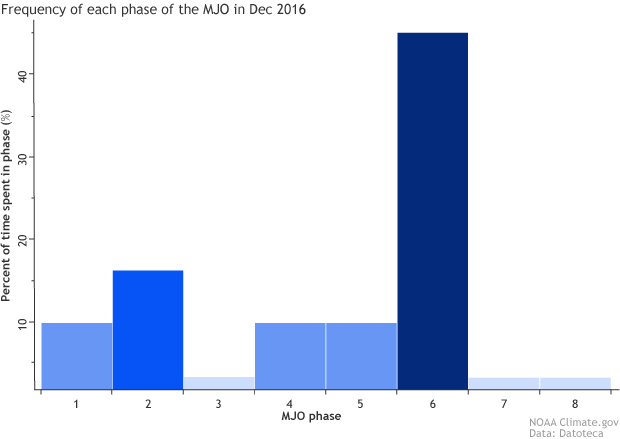
Percentage frequency of occurrence of each phase of the MJO during December 2016. The percentages add up to 100%. Although phase 6 was by far the most prevalent (occurring about 45% of the time), in an absolute sense the MJO was still quite weak.
We could also look at more regional phenomena in order to account for the increased precipitation. Two very important patterns of climate variability that impact southeastern South America’s rainfall basically all year around are the Southern Annular Mode (SAM), also known as the Antarctic Oscillation (AAO; see Marshall, 2003)—a pressure system surrounding Antarctica—and the South Atlantic Convergence Zone (SACZ)—a strong elongated region where winds meet across Brazil into the southwest Atlantic (see Carvalho et al., 2002, 2004). In December, these two patterns (footnote 2) favored persistent wind circulations bringing moisture from the humid Amazon into southern Paraguay and neighboring regions (see the figure below), promoting intense rainfall events (see the first figure in this piece).
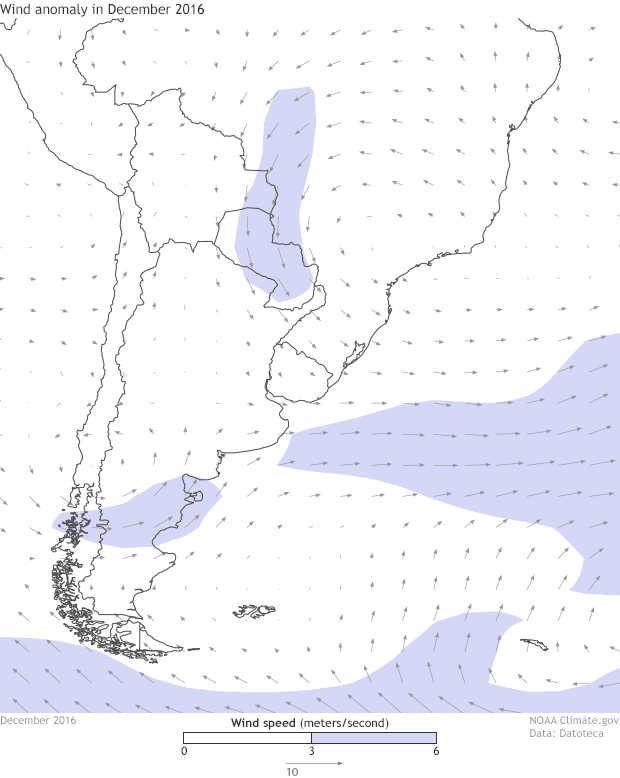
Low-level (850 mb) wind anomaly vectors for December 2016. The arrows show both the wind speed (length of arrow) and the wind direction. The speed units are meters per second. A reference vector of 10 meters per second is indicated below the color bar. The color shadings indicate speed.
This counterpointing (footnote 1) between ENSO and SACZ, SAM and other climate patterns is more common than one might expect; for details see Muñoz et al. (2015).
Recipe for a tune
As Emily Becker explained in the previous piece on this blog, it is not trivial to disentangle the role of each climate feature—each instrument in the symphony—because they affect each other in complex ways.
A simple way to illustrate how a competing climate signal can play up or play down the ENSO rainfall signal in a particular place is to imagine they have similar strength and consider how synchronized they are (see the figure below). For example, “constructive interference” occurs when they are both in phase (or in the same direction), in which case the rainfall anomaly typically associated with ENSO is enhanced by the presence of the second signal, and thus more pronounced extreme events could happen. Or the signals could be in opposition—destructive interference—and nullify each other, producing near-normal rainfall conditions. And of course, things could be a lot more complicated than these two scenarios, as the presence of a particular climate feature could modify the behavior of another, and vice-versa.
Two climate signals interfering (i.e., combining) with each other. Bold blue curve sketches the result of the combination. Horizontal bars indicate conceptual thresholds for occurrence of extremely wet and dry events. Animation adapted by Climate.gov from http://www.acs.psu.edu/drussell/Demos/superposition/superposition.html.
Suppose these interferences are occurring and impacting precipitation somewhere in the world, but we are only focused on the most commonly known, and usually stronger, ENSO signal. We would be expecting a typical El Niño or La Niña rainfall pattern but getting something else because we did not pay enough attention to or could not correctly account for the other signals. This is why it is so important for us that our forecast models can adequately capture these interactions. A better understanding of the global climate symphony and its better representation in our models will most likely provide more skillful predictions around the world.
Acknowledments
Thanks to Mariano Álvarez (CIMA), Luis Alfonso López (IDEAM), Max Pastén (DINAC) and the editors of this blog for useful discussion.
Lead Reviewer: Anthony Barnston, IRI
Footnotes
(1) In music, counterpoint refers to two (or more) melodies in combination with one another, or a melody and the orchestra played in conjunction with one another, and often forming a contrast. More generally, it pertains to a theme creating a contrast to a main element. In climate science, it can be used to describe a combination or interplay of two or more phenomena occurring together, creating a net result.
(2) Since the SACZ index is not available yet in real-time, the author used the relatively new CSIS index, kindly provided by Dr. Mariano Álvarez (CIMA-Universidad de Buenos Aires, Argentina). For details see Álvarez et al (2014).
References
Álvarez, M.S., Vera, C.S., Kiladis, G.N. et al. Clim Dyn (2014) 42: 3253. doi:10.1007/s00382-013-1872-z
Carvalho, L. M. V., C. Jones, and B. Liebmann, 2002: Extreme precipitation events in southeastern South America and large-scale convective patterns in the South Atlantic convergence zone. J. Climate, 15, 2377–2394, doi:10.1175/1520-0442(2002)015,2377: EPEISS.2.0.CO;2.
Carvalho, L. M. V., C. Jones, and B. Liebmann, 2004: The South Atlantic convergence zone: Intensity, form, persistence, and relationships with intraseasonal to interannual activity and extreme rainfall. J. Climate, 17, 88–108, doi:10.1175/1520-0442(2004)017,0088:TSACZI.2.0.CO;2.
Marshall, G. J., 2003: Trends in the southern annular mode from observations and reanalyses. J. Climate, 16, 4134–4143, doi:10.1175/1520-0442(2003)016,4134:TITSAM.2.0.CO;2.
Muñoz, Á. G., L. Goddard, A. W. Robertson, Y. Kushnir and W.Baethgen, 2015: Cross-time scale interactions and rainfall extreme events in southeastern South America for the Austral Summer. Part I: Potential predictors. J. Climate, 29, 5915-5934.
Wheeler, M. C., and H. H. Hendon, 2004: An all-season real-time multivariate MJO index: Development of an index for monitoring and prediction. Mon. Wea. Rev., 132, 1917–1932, doi:10.1175/1520-0493(2004)132,1917:AARMMI.2.0.CO;2.
Comments
Thank you
RE: Thank you
That means that we will still suffer extreme drought.
RE: That means that we will still suffer extreme drought.
La nina
RE: La nina
NIÑA + MJO signals combined
RE: NIÑA + MJO signals combined
Great Post and References!
RE: Great Post and References!
Central América
RE: Central América
Informative Discussion
Comments have been disabled on this article