Catch a wave: how waves from the MJO and ENSO impact U.S. rainfall
Marybeth Arcodia is an Atmospheric Science Ph.D. Candidate at the University of Miami Rosenstiel School of Marine and Atmospheric Science. She works with Dr. Ben Kirtman (previous ENSO Blog guest writer) studying climate variability and predictability. Along with a few members from her lab group, Marybeth helped create a subseasonal-to-seasonal forecasting blog called Seasoned Chaos, for scientists and non-scientists alike. Her research looks at how particular atmospheric and oceanic conditions in the tropical Indian and Pacific Oceans can affect weather and extreme events in the United States to lead to more confident climate forecasts on two week to two month time scales. She received her BA in Mathematics from Georgetown University in 2014.
The famous Beach Boys lyric “Catch a wave and you’re sitting on top of the world” has a lot more to do with atmospheric science than one may realize. Our latest research has found that two atmospheric wave patterns forced from tropical systems, ENSO and the Madden-Julian Oscillation, work together to affect rainfall patterns in the United States, sometimes leading to extreme flooding or drought events (Arcodia et al. 2020). Luckily, climate forecasters can analyze these large-scale waves to make predictions weeks and months in advance.
The MJO launches into action
Particularly important to U.S. weather and climate are atmospheric waves that start in the tropics and travel to the midlatitudes. One major source of these waves is the Madden-Julian Oscillation (MJO). The MJO sounds fancy and, let’s be honest, boring, but it’s not! The MJO is a system of very tall or deep convective clouds (storminess) that travels eastward along the tropical Indian and Pacific Oceans approximately every 30-60 days. The convective region of the MJO has enhanced storms and rainfall, and it is usually sandwiched to the east and west by dry, sunny areas.
Averages of all January–March MJO events from 1979–2016. Green shading shows below-average OLR (outgoing longwave radiation, or heat energy) values, indicating more clouds and rainfall, and brown shading identifies above-average OLR (drier and clearer skies than normal). The purple contours show the location and strength of the Pacific jet at the 200-hPa level (roughly 38,000 feet at that location). Note the eastward movement of the wet and dry areas. How far the Pacific jet extends past the international dateline also changes with the phase of the MJO. NOAA Climate.gov animation, adapted from original images provided by Carl Schreck.
These convective storms form from surface convergence of winds, which then rise and diverge at the top of the troposphere. The convection disrupts the air at the top of the atmosphere, which results in long, planetary scale (~5,000 miles) waves that travel away from their tropical source into the midlatitudes near the top of the troposphere, like waves that ripple away on top of a lake from skipping stones. (1) These large-scale waves, known as Rossby waves, are due to the rotation of the Earth and characterized by north-south undulations around high and low pressure systems. Like most waves, these waves carry signals: radio waves carry classic rock to your car, microwaves carry microwave radiation to heat your frozen dinner, and atmospheric waves carry temperature, pressure, and wind signals that can alter the weather.
The atmospheric waves produced by the MJO can have different effects on the mid-latitudes depending on where the MJO convection (storminess) is on its journey from the Indian Ocean to the central Pacific (2). Our study analyzed the influence of the MJO during the Northern Hemisphere winter months, November-April, as this is when the MJO is typically strongest. We specifically focus on U.S. rainfall impacts since both drought and flooding events have vast societal, economic, and environmental impacts. While most prior studies investigated influences from the MJO on the West Coast, we focused on a strong relationship we discovered in the Southeast U.S. When the MJO starts out in the Indian Ocean and makes its way across Indonesia, the ripples it causes in the upper atmosphere often lead to a change in U.S. pressure patterns. Warm, moist air from the Gulf of Mexico is pushed over the Southeastern states, leading to rainfall. As the MJO makes its way into the central Pacific, the opposite pressure patterns head cool, dry air from the north to cause dryness in the Southeast U.S.
Another defining characteristic of the MJO is the dryness on both the east and west sides of the enhanced rainfall on the equator. These dry regions also create waves because of the sinking motion at the top of the atmosphere. An exciting area of research that others in our field are working on is how the waves from the rainy and dry regions of the MJO interact and influence North American weather patterns as the MJO is travelling around the globe (Lin et al., 2010, Tseng et al., 2011).
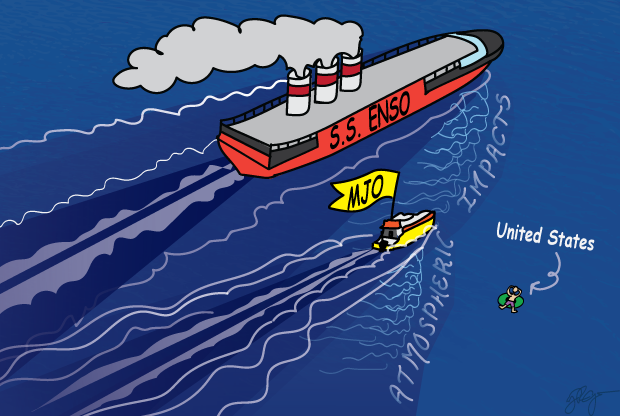
The S.S. ENSO cruise ship and MJO speedboat making their way across the "harbor" of the tropical Pacific Ocean. The cruise ship represents the stationary ENSO pattern creating steady, rolling waves. The speedboat represents the rapidly moving MJO travelling through the waves created by the S.S. ENSO, altering the wake that the MJO speedboat is producing. The floating person represents the United States that feels the impact from the both the cruise ship's wake and the speedboat's modified wake. Note that United States refers to just a specific region in the U.S. that changes with time. The impacts from the MJO and ENSO wave interference can vary both in space and time. Climate.gov cartoon by Emily Greenhalgh.
MJO & ENSO synergy
Things get really choppy when we add ENSO to the mix. ENSO is a stationary pattern in the tropics, but the MJO is a traveling pattern roughly following the equator. In fact, ENSO is controlling the background through which the MJO is moving. Specific MJO events can vary depending on the state of ENSO. The strength of the MJO convection, how fast it moves eastward, and how far it travels all change based on ENSO conditions. These ENSO-modified MJO events then lead to varied impacts on U.S. rainfall.
Imagine a massive cruise ship very slowly making its way back and forth through a harbor. As it moves, it creates steady, rolling waves. The MJO is then a speedboat, passing through the wake of the cruise ship. There are now two boats forcing waves in the same water. ENSO (cruise ship) modifies the MJO (speedboat) by altering the environment that the MJO is moving through. Since the speedboat is moving through already wavy water, it changes the wake that the speedboat produces (3).
To complicate things further, these modified MJO waves and the ENSO waves are now both traveling at different speeds at the top of the atmosphere and interact with each other, in the same way the wakes from two boats interfere. The interaction of these waves and their signals plays a role in U.S. weather via changes in pressure, temperature, etc.
Two climate signals interfering (i.e., combining) with each other. Bold blue curve sketches the result of the combination. Horizontal bars indicate conceptual thresholds for occurrence of extremely wet and dry events. Animation adapted by Climate.gov from http://www.acs.psu.edu/drussell/Demos/superposition/superposition.html.
The waves from the MJO and the waves from ENSO together impact U.S. rainfall through constructive or destructive interference. Constructive interference occurs when two waves are in phase (4), and the resultant wave has a much larger amplitude, resulting in a stronger signal than either of the individual waves. The opposite, called destructive interference, occurs when two waves are out of phase and cancel each other (5). You may have experienced destructive signal interference when your radio signal gets interrupted by another station and you hear a mix of two stations or no sound at all.
We can analyze constructive and destructive interference from the MJO and ENSO by looking at each U.S. rainfall signal individually (6). We can specifically look at the U.S. rainfall contribution from both the MJO and ENSO, for example, when the enhanced MJO convection is over Indonesia and an El Niño is happening, or when the MJO convection is in the central Pacific and La Niña is occurring. Since the MJO changes phase much faster than ENSO, we often see U.S. conditions from ENSO persist for an entire season, whereas the rainfall from the MJO can change weekly.
Constructive interference from the MJO and ENSO occurs when either wet or dry conditions occur in the same region simultaneously from both phenomena. Their signals are added together and the result is a much wetter- or- drier-than-average region. Destructive interference occurs when the same region experiences opposite signals from the MJO and ENSO, partially or fully masking one another.
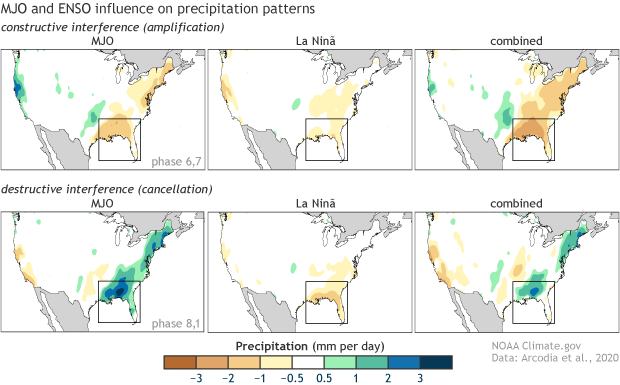
Precipitation in mm/day broken down by active MJO phase during the winter months (Nov-Apr) of the 1998-2001 La Niña event (cold ENSO phase). The plot shows MJO-only rain (left), ENSO-only rain (center), and MJO + ENSO rain (right). Black boxes denote prominent areas of constructive (top) or destructive (bottom) interference. This example shows that both constructive (amplified signal) and destructive (weakened signal) can happen during different MJO phases in the same ENSO event. Climate.gov image based on data from Arcodia et al. 2020.
Where have I seen this before?
Destructive interference can even lead to a total wipeout of a signal. We saw that during the 1998-2001 La Niña event. The wave from La Niña resulted in drier-than-normal conditions in the Southeast U.S., a common characteristic of La Niñas. However, when the MJO was either just forming or dissipating during the La Niña event, it brought wetter-than-average conditions to the same region. These two waves destructively interfered, essentially canceling each other out. (7) The result was simply average rainfall (no wetter- or drier-than-normal conditions) for that time period in the Southeast U.S.
Constructive interference can also have notable impacts since the result is an intensified signal. This occurred in December 2015 when both the MJO and ENSO signals brought large amounts of rain to the Mississippi basin region, leading to massive flooding (Arcodia et al., 2020) (8). Flash droughts, rapidly developing droughts that can persist for weeks to months, can also be attributed to constructive interference. One such example was the summer of 2000 flash drought in the Southern U.S. when an ongoing La Niña event and active MJO both likely contributed dry signals to the region.
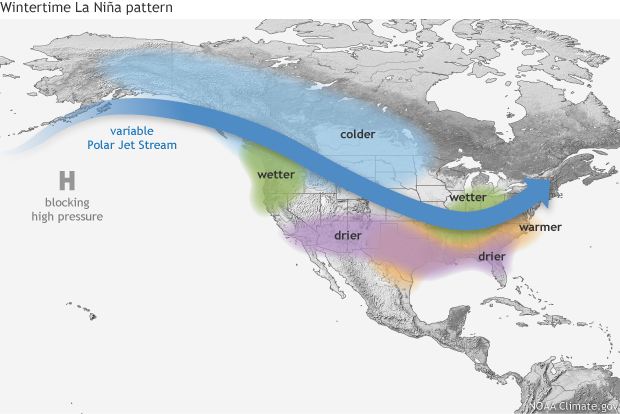
Typical impacts of La Niña on U.S. winter temperature and precipitation. Such impacts have been associated with past episodes, but all impacts aren't seen with every episode. NOAA Climate.gov drawing by Fiona Martin.
Analysis of these events shows just how connected the tropics and the United States can be. Understanding how these waves interfere can improve our one-to-two week and monthly climate forecasts of temperature and precipitation. A longer lead time in a forecast for massive flooding or drought events can save lives, property, and money if our climate models can catch the waves from the MJO and ENSO. These atmospheric waves may not have us sitting on top of the world like the Beach Boys told us, but they are traveling pretty close (top of the troposphere to be exact) and could still have a big impact on the California surf.
Lead edited by Tom Di Liberto
Footnotes
(1) This coupling between deep convection and a circulation pattern characterized by low-level convergence, upper-level divergence, and vice versa (sinking motion due to upper-level convergence and low-level divergence) is similar to the tropical Walker cell.
(2) The location of above-average and below-average tropical convection can be seen in this graphic on the CPC MJO page.
(3) It is also believed that since the MJO itself is altered, then so are the atmospheric waves it produces that travel to the U.S.
(4) In-phase waves have their highest and lowest points aligned.
(5) Out-of-phase waves will drastically reduce the amplitude, or height, of the waves which causes the resultant wave to be nearly flat and lose its signal.
(6) We analyze the signals based on the state of each system: location of convective storms for the MJO and sea surface temperatures for ENSO. We then calculate the amount of rainfall that each signal contributed during specific conditions in the tropics, that is whether each contributed to wetter or drier conditions than average.
(7) We saw this in California during the massive 2015-16 El Niño event. California often experiences much wetter-than-normal conditions during El Niños. During this event, however, the El Niño signal brought only a small amount of rain (Paek et al., 2017; Yang et al., 2018) and the MJO brought a dry signal to the California region. When the two are added together, the signals slightly cancel each other out and played a role in the drought in the California region during that time. During this particular case, El Niño did not bring the expected rain, and the MJO brought dryness, and the result contributed to a drought in California during a time when they expected a lot of rain.
(8) According to NOAA’s National Center for Environmental Information (https://www.ncdc.noaa.gov/sotc/national/201513 ), December 2015 was the only month in their 121-year period of record with both the title of warmest and wettest month. Furthermore, the severe precipitation events caused record flooding, severe weather, and heavy snowfall resulting in over 50 fatalities, the deadliest weather event of 2015.
Works Cited:
Arcodia, M. C., B. P. Kirtman, and L. S. P. Siqueira, 2020: How MJO Teleconnections and ENSO Interference Impacts U. S. Precipitation. J. Climate, 33, 4621–4640.
Lin, H., G. Brunet, and R. Mo, 2010: Impact of the Madden–Julian Oscillation on Wintertime Precipitation in Canada. Mon. Wea. Rev., 138, 3822–3839, https://doi.org/10.1175/2010MWR3363.1
Paek, H., J.-Y. Yu, and C. Qian (2017), Why were the 2015/2016 and 1997/1998 extreme El Niños different?, Geophys. Res. Lett., 44.
Tseng, K., E. Maloney, and E. Barnes, 2019: The Consistency of MJO Teleconnection Patterns: An Explanation Using Linear Rossby Wave Theory. J. Climate, 32, 531–548, https://doi.org/10.1175/JCLI-D-18-0211.1.
Yang, X. S., Jia, L. W., Kapnick, S. B., Delworth, T. L., Vecchi, G. A., Gudgel, R., Underwood, S., & Zeng, F. R. (2018). On the seasonal prediction of the western United States El Nino precipitation pattern during the 2015/16 winter. Climate Dynamics, 51( 9‐10), 3765- 3783.
Comments
ENSO drives MJO
Nice Information.
MJO and ENSO
Good analogies for explaining MJO and ENSO
Listen to Eric Snodgrass - Farmer in the Midwest.
Very helpful for longterm marketing of corn and soybeans
Thanks
Comments have been disabled on this article