What to expect this winter: NOAA’s 2016-17 Winter Outlook
Will we or won’t we see La Niña emerge this year? Does it even matter? Shoot, if one of the strongest El Niño episodes in history didn’t deliver much drought relief to California last winter, what are the chances for significant improvement this year? I’ll attempt to answer these and other questions here in my 5th blog post. If you'd rather watch a video recap of the winter outlook, we have that, too.
Mike Halpert of NOAA's Climate Prediction Center talks about La Niña and other climate patterns that are likely to influence winter climate across the United States. NOAA Climate.gov video by Ned Gardiner, Alicia Albee, Kurt Mann, Robert Klein, and Bruce Sales.
This blog is brought to you by the letter p, for “probability”
So what might influence our climate this winter? As you know from the ENSO blog, there is a link between the fall and winter conditions across the tropical Pacific and the average winter climate in the U.S. If the likely La Niña develops, certain patterns of temperature and precipitation would be favored across the country. Over the past few years, we’ve discussed the patterns favored by El Niño, but haven’t really discussed what we often see during La Niña winters. Roughly speaking, La Niña impacts are opposite to what is observed during El Niño winters (see the figure).
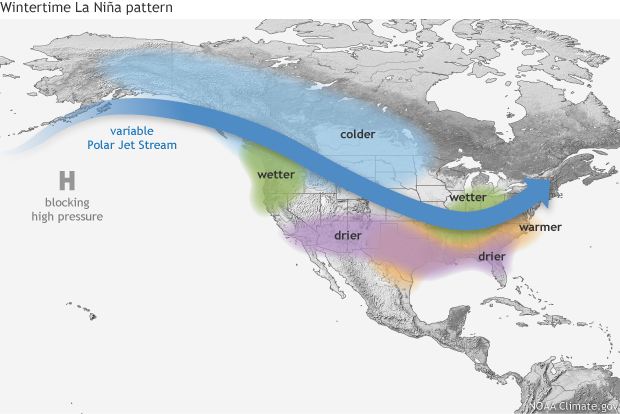
Typical impacts of La Niña on U.S. winter temperature and precipitation. Such impacts have been associated with past episodes, but all impacts aren't seen with every episode. NOAA Climate.gov drawing by Fiona Martin.
So while the southern (and especially southeastern) part of the U. S. is often wetter and colder than average during El Niño winters, La Niña generally favors below-average precipitation and above-average temperatures in those same regions. We also often see opposite patterns across the northern part of the nation, with warmer and drier conditions during El Niño winters and colder and wetter conditions during La Niña years.
Before discussing the actual winter outlook, I want to remind readers that these are probabilities (% chance) for below, near, or above average seasonal climate outcomes with the maps showing only the most likely temperature or precipitation outcome (footnote 1). Because the probabilities shown are less than 100%, it means there is no guarantee you will see temperature or precipitation departures that match the color on the map. As we’ve explained in earlier blog posts, even when one outcome is more likely than another, there is still always a chance that a less favored outcome will occur (witness precipitation last winter over the western United States).
Precipitation outlook
Given the potential La Niña, it’s not surprising that both the temperature and precipitation outlooks are consistent with typical La Niña impacts. However, because there is still some uncertainty that La Niña will develop and persist through the winter, probabilities on the maps this year are fairly conservative, smaller than the ones in the outlook last year.
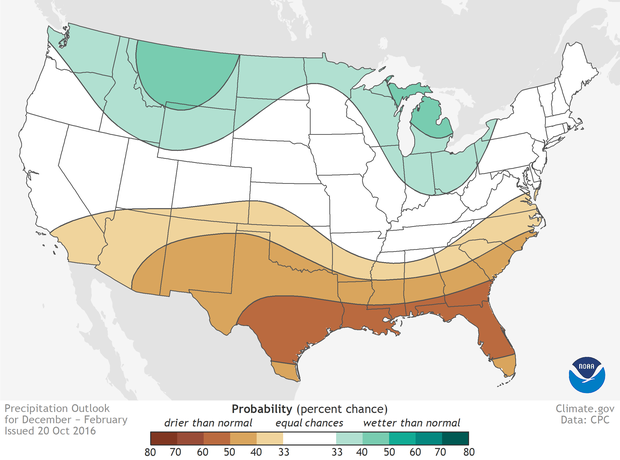
Outlook for average winter precipitation the United States (large version shows Alaska and Hawaii) for December 2016–February 2017. Anywhere in the United States, there is always a chance that the average winter precipitation will be near average, well above average, or well below average. White areas show places where the odds for all three possible outcomes are equal (33%). Colored areas show where—and by how much—the odds favor well above average (greens) or well below average (browns) precipitation. "Well above" and "well below" mean "in the upper or lower third of the climatological record." NOAA Climate.gov map based on NWS Climate Prediction Center data.
As shown in the figure above, the winter precipitation outlook favors below-normal precipitation across the entire southern U. S. and southern Alaska, with probabilities greatest (exceeding 50%) across the Gulf Coast from Texas to Florida. This also includes southern California and the Southwest, although the shift in the probabilities in these locations is very small, barely tilting the odds toward below average. In contrast, above-average precipitation is favored in the northern Rockies, around the Great Lakes, in Hawaii, and western Alaska. This forecast does not bode well for drought in the country, as we’ll likely see drought persist in central and southern California and the Southwest and potentially expand in the Southeast. Thus, the likely weak La Niña means California drought relief is not likely.
Temperature outlook
The temperature outlook (see the figure below) favors above-average temperatures across the southern U. S., extending northward through the central Rockies, in Hawaii, in western and northern Alaska and in northern New England. Chances are highest in an area extending from the desert Southwest to central and southern Texas (greater than 50%), with a greater than 6 in 10 chance in southern New Mexico and western Texas. Odds favor colder-than-normal temperatures along the northern tier from Washington eastward to the Great Lakes. However, the likelihood of below-average temperatures across the North is modest, with no regions reaching 50%.
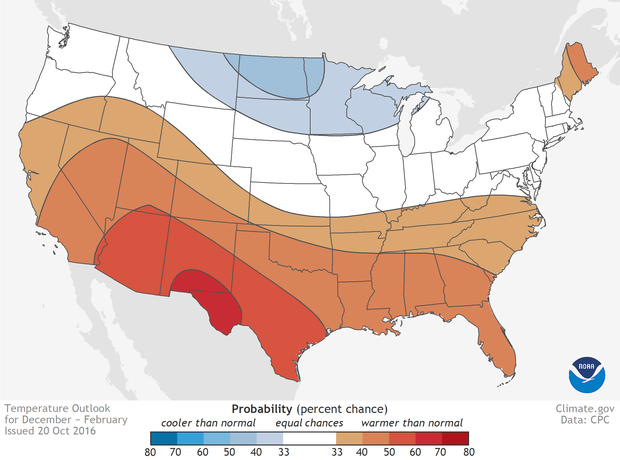
Outlook for average winter temperature across the United States (large version shows Alaska and Hawaii) for December 2016–February 2017. Anywhere in the United States, there is always a chance that the average winter temperature will be near average, well above average, or well below average. White areas show places where the odds for all three possible outcomes are equal (33%). Colored areas show where—and by how much—the odds favor well above average (reds) or well below average (blues) temperatures. "Well above" and "well below" mean "in the upper or lower third of the climatological record." NOAA Climate.gov map based on NWS Climate Prediction Center data.
Both maps include blank regions where neither above-, near- nor below-normal is favored. These areas (shown in white and labeled EC for “equal chances”) have the same chance for above, near, or below-normal (33.33%) average seasonal climate conditions. This doesn’t mean that near-average temperature or precipitation is favored this winter in those regions, but rather that there’s no tilt in the odds toward any seasonal outcome.
Last winter’s outlook
And before I close, let’s take a quick look back at how last winter’s CPC outlooks fared, since we neglected to do that last spring. Because we had such a strong El Niño last winter, we issued forecasts of temperature and precipitation with relatively high probabilities compared to our past seasonal outlooks. And that certainly worked out well for those parts of the nation where we favored above-normal temperatures, as shown in the figure below.
In fact, most of the temperature outlook verified, with the Heidke Skill Score (footnote 2) approaching +70, meaning that the forecast was correct for about 80% of the locations (in areas where a forecast was made). With above average temperatures largely blanketing the nation from coast to coast, only the forecasts in the southern Plains and along the Pacific Northwest coast were missed.
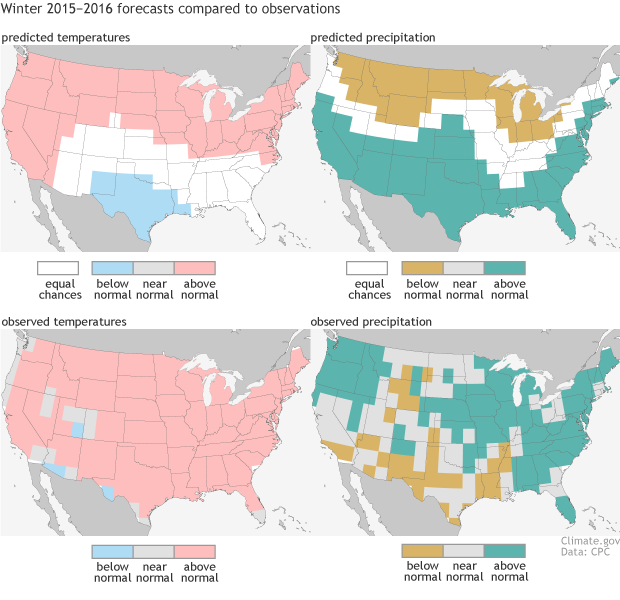
(top row) Seasonal temperature (left) and precipitation (right) outlooks for December-February 2015-16 made in October 2016, compared to actual conditions (bottom row). The color indicates the category having the highest forecast probability. White areas show “equal chances” for any of the three categories. In the observations, colors indicate below or above normal, and gray is near normal.
The precipitation outlook, on the other hand, did not do very well, and was, in fact, quite disappointing, scoring near zero. As shown in the figure above, while the forecast pattern favored above-normal precipitation across most of the South and along the East Coast, the observed pattern was shifted somewhat north, with much of the northern parts of the country experiencing a wetter-than-average winter, and the southwestern and south-central U. S. being either normal or drier than normal. Only along the East Coast was there a match between the observations and the favored forecast category.
This closing brought to you by the letter l, for “long game”
Making seasonal forecasts remains a very challenging endeavor. Seasonal climate forecasts are not as skillful as weather predictions, and phenomena like El Niño or La Niña only provide some clues, not certainty, as to what might occur during an upcoming season. Longer-term trends are also an important player as well.
And while we are aware of and participating in ongoing research on new strategies for seasonal predictability—for example, the possible influence of fall Arctic sea ice extent and Siberian snow cover on subsequent Northern Hemisphere winter climate—at this point, these relationships are still being tested. It is not yet clear how they might improve predictions beyond the current set of tools that we already consider. (Note: Many state-of-the-art climate models are run using recent conditions of sea ice and snow).
CPC issues probabilistic seasonal forecasts so users can take risk and opportunities into account when making climate-sensitive decisions. The maps show only the most likely outcome where there is greater confidence, but this is not the only possible outcome. As we saw last winter in California, even the less likely outcome can and sometimes does occur.
It’s natural to wonder what good a seasonal forecast is if it winds up with a skill score of zero. However, keep in mind that these outlooks will primarily benefit those who play the long game. That’s because even though some seasons are a bust, over the span of many years, the forecasts are right more often than you’d expect due to chance.
Footnotes
(1) The three possible categories of outcome are below normal, near normal and above normal. These categories are defined by the boundaries separating them, called terciles. The terciles, technically, are the 33.33 and 66.67 percentile positions in the distribution. In other words, they are the boundaries between the lower and middle thirds of the distribution, and between the middle and upper thirds. The distribution consists of the observations, for the season and the location in question, over the 30 years of 1981-2010. The CPC forecasts show the probability of the favored category only when there is a favored category; otherwise, they show EC (“equal chances”). In the maps, the probability is shown only for the favored category, but not for the other two categories. Often, the near-normal category remains at 33.33, and the category opposite the favored one is below 33.33 by the same amount that the favored category is above 33.33. When the probability of the favored category becomes very large, such as 70% (which is very rare), the above rule for assigning the probabilities for the two non-favored categories becomes different.
(2) As stated in one of Tom’s previous blogs about verification measures, the Heidke Skill Score (or HSS) is computed as the number of grid points that had a correct categorical forecast, minus the number of grid points expected to be correct by pure chance. The difference between these two numbers is then divided by the total number of grid squares across the country, but after subtracting from that total the number expected by chance. Then we multiply by 100 so that it is expressed as a percentage instead of as a proportion. Note that we are only scoring those grid points that did not have an “equal chances” (EC) forecast. As a formula, the above is written:
HSS = (hits – expected hits) / (total – expected) and then multiply the result by 100.
For example, suppose there are 220 grid squares across the U. S., but 120 of them have the EC forecast. We ignore those points with EC, and only score the 100 that are not EC points—i.e., only those points that have a forecast tilted toward below-normal, near-normal or above-normal. Suppose 40 of those points turn out to have a correct forecast, which means that the observations turned out to match the category that the forecast favored, even if the probability involved in the forecast was only weakly greater than 33.33%. Now, with 100 points being verified, we expect 33.3 of them to be matches just by chance, since there are 3 categories having equal likelihood on average, and even if we knew nothing, we would be expected to guess correctly one-third of the time, on average. So, plugging numbers into the formula, we would get:
HSS = (40 – 33.3) / (100 – 33.3) and this gives us 0.10.
Then multiplying by 100, we get a score of 10%.
Lead reviewer: Tony Barnston, IRI
Comments
Data
USEFUL. Thank you for posting
thank you
Acccuracy
hello from up north
RE: hello from up north
Yes, they are! You can find the forecasts for Alaska and Hawaii on the CPC website: http://www.cpc.ncep.noaa.gov/ .
RE: hello from up north
RE: RE: hello from up north
Good point! Thanks!
When do we see rain in Southern California
data
La Niña Modoki
Snow
RE: Snow
Snowfall forecasts are not explicitly issued by the Climate Prediction Center as the forecasts for temperature and precipitation are. However, you can surmize a snowfall forecast, at least approximately, from the temperature and precipitation forecasts. For example, above average snowfall can be inferred from the combination of a tilt of the odds toward below normal temperature and simultaneously toward above normal precipitation, such as in the Great Lakes region and the northern Rockies. But I say "approximately" because it is not quite that straightforward. It is possible that during the Dec-Feb season, episodes of below normal temperature may not coincide with episodes of above normal precipitation. In other words, the sub-seasonal timing may not be conducive to combining low temperatures with high precipitation. Therefore the surmized snowfall forecast based on seasonal temperature and precipitation forecasts must be accompanied with this caveat, and some consequent uncertainty.
Inaccurate predictions
RE: Inaccurate predictions
Are you basing your assessment of the value of the climate predictions on a couple of cases? It looks that way, and that's not very smart. Funding of climate prediction services is based on much longer-term accuracy assessments. I believe these track records are available on Climate Prediction Center's web pages, in the form of a graph showing the "Heidke skill score". Also, a scientific article showing the longer-term accuracy of the forecasts is available in the "Weather and Forecasting" journal, at the link http://journals.ametsoc.org/doi/abs/10.1175/WAF-D-11-00143.1. Other similar articles exist. The page you'll get from that link offers the opportunity to open or download the full article in pdf format. You'll see that the highest accuracy (or skill) scores are in winter, and that overall the forecasts are clearly more accurate than the flip of the coin, but with some individual forecasts busting, like last winter's precipitation forecast (as you pointed out). About this year's La Nina, I don't quite see how you come up with it being a bad forecast. Although it is not over yet, it looks as if the forecast was for a weak La Nina, and so far that is what it looks like is happening. As far as the associated winter climate impacts in the US, we need to wait longer and see how it plays out. So the bottom line is that your criticism is welcome but appears to have been made without very much thought. We admit that last winter's precipitation forecast was a lousy one.
RE: RE: Inaccurate predictions
RE: RE: RE: Inaccurate predictions
A couple of points I will add to Tony's response. First, you are mashing up the predictions of El Niño and the predictions of winter precipitation into a single thing: they are separate things. In September of 2015, forecasters reported a 95% chance that El Niño would continue through winter. It did continue. The model did not fail.
Following that prediction and taking it and other important influences into consideration, US forecasters issued the prediction for US winter precipitation: nowhere in the US had a 90% probability of a much wetter than usual winter. The probabilities for a much wetter than usual winter across most of the classic "El Niño affected regions" of the South ranged from 33% to 60% chance. The absolute highest chance of a much wetter than usual winter was 73% in Florida.
[[{"fid":"20653","view_mode":"default","fields":{"format":"default","field_file_image_alt_text[und][0][value]":false,"field_file_image_title_text[und][0][value]":false,"field_caption[und][0][value]":"","field_caption[und][0][format]":"full_html","alignment":""},"type":"media","field_deltas":{"1":{"format":"default","field_file_image_alt_text[und][0][value]":false,"field_file_image_title_text[und][0][value]":false,"field_caption[und][0][value]":"","field_caption[und][0][format]":"full_html"}},"link_text":null,"attributes":{"height":"669","width":"610","class":"media-element file-default","data-delta":"1"}}]]
It's true that southern California and the Southwest didn't get the soaking they were hoping for, but the forecasted odds of that happening were not 90%. They were 50-60%. And in Florida, where the forecast predicted the odds were highest, the winter was wetter than normal. (You can check for yourself here: https://gis.ncdc.noaa.gov/maps/ncei/cag).
So, while the actual winter didn;t match the forecast point for point 100%, it did match in some places, which means that you can't make a simplistic blanket statement like "it failed." Reality is more nuanced than that. Tom has written no fewer than three posts (1, 2, 3) devoted to explaining how forecasters evaluate and critique their work. If you truly want to understand Tony's statement that seasonal forecasts may not be perfect, but they are demonstrably better than flipping a coin, you can dive into those articles.
My final response to you is about the nature of your criticism. We can handle criticism of our work, including the opinions of those who question the value of it. We ask readers to offer comments and criticisms honestly but respectfully; to distinguish between their opinions and facts; to refrain from repeating widely debunked myths or conspiracy theories for which there is no credible evidence; and to avoid name-calling, profanity, personal attacks, and general meanness. Your statement about forecasters committing fraud is out of bounds, regardless of the qualifying "seems" and "almost" you added. It's a personal attack on forecasters' integrity, and you offer no credible evidence to support a claim of fraud. We won't publish further comments like that, so if you want to continue to participate here, please keep that in mind.
RE: Inaccurate predictions
La Nina-dry?
RE: La Nina-dry?
Climate outlooks are probabilistic meaning they give a percent chance (%) for a certain outcome. They do not guarantee (100%) any particular outcome in all locations. As illustrated by the rainfall in California over the last month or so, the 33-40% chance of below-median precipitation in southern CA is not panning out. This does not mean these predictions are worthless. As Rebecca has pointed out in the previous comment the goal is to be correct more often than random chance. To properly evaluate probabilistic outlooks one has to look at many years of forecasts to see if they are reliable. Meaning that, over a long time period, when we say there is a 40% chance of something happening in a particular location, it should actually occur roughly 40% of the time (meaning that 60% of the time this outcome should *not* occur).
The IPCC projections also provides probabilities or a range of the *most likely* outcomes depending on future emission scenarios. You can read the AR5 summary clicking here.
RE: RE: La Nina-dry?
RE: RE: RE: La Nina-dry?
As Michelle mentioned in the previous reply, climate outlooks are probabilistic in nature. And it is very rare (hasn't happened yet) that you would see a 100% chance of dry/wet or cold/warm than normal where you would know right away that the forecast "failed". In order to verify these sorts of forecasts to determine whether they have any skill above guessing you have to play the long game and look at how these outlooks performed over a longer period of time. I wrote three pieces for the ENSO blog on just how we verify these forecasts. I recommend giving them a look. Part 1, Part 2, Part 3.
Comments have been disabled on this article