Seasonal Verification Part 2: Electric Boogaloo
In my last post, I showed the last ten years’ worth of December through February (DJF) winter forecasts and observations (2004-2013) and allowed our eyes to tell us their thoughts on just how well those forecasts did. It appeared that some forecasts were better than others, but there was a wide mix of forecast performances not only from year to year, but from place to place. It was hard to tell, on average, how well the forecasts did.
“Eyeballing” the difference between a forecast and observations, while easy, is subjective and potentially inaccurate, in the end. We need verification metrics – statistical analyses that boil down everything our eyes see into numbers—to really put forecast performance into context. These metrics can validate how often our forecasts are “right.” This is about as far I as went during that last post. I left you with a cliffhanger. What are these mysterious metrics that can do the job our eyes fail to do?
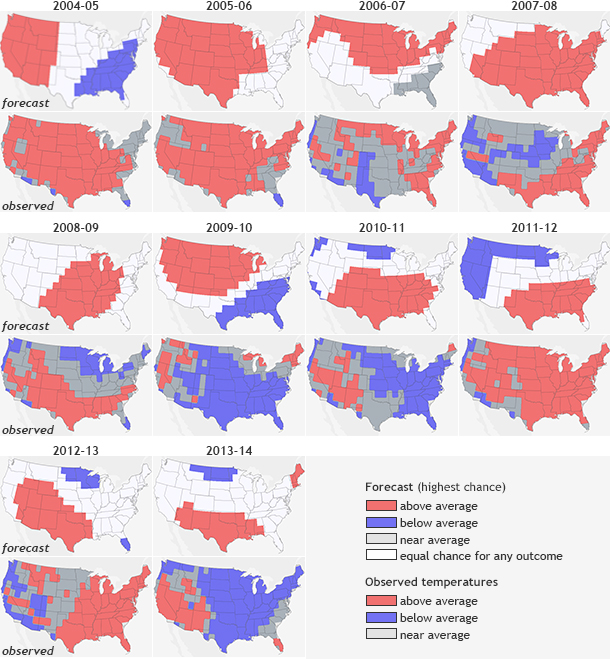
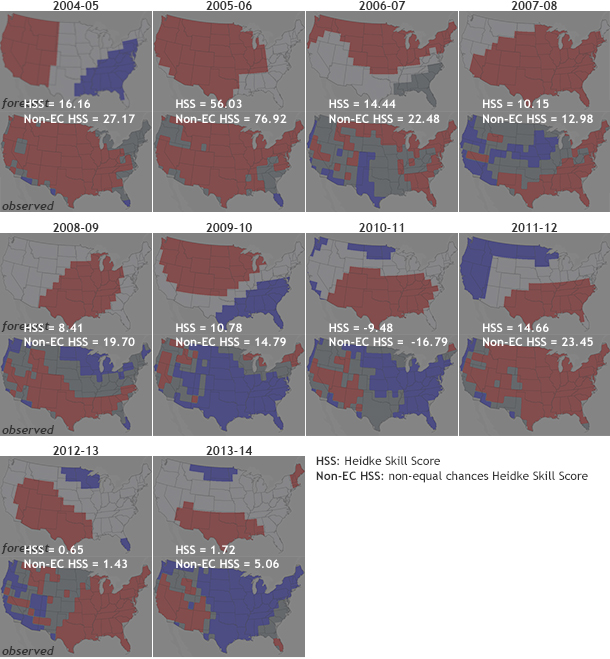
Paired rows of maps of December–February temperature forecasts (top) and observations (bottom) from 2004-2013. Grab and drag the slider to view the Heidke Skill Scores (HSS) for each outlooks. Each map forecast gets two HSS scores: one for all grid locations and a second that omits all the areas where the forecast predicted "equal chances" of above-, below-, or near-normal temperatures. Any score above 0 means the forecast was better than a random guess. Maps by NOAA Climate.gov, based on data from the Climate Prediction Center.
One metric used at the Climate Prediction Center is called the Heidke Skill Score (HSS) (Heidke 1926, O’Lenic et al. 2008). The HSS is used to verify forecasts like those in Figure 1, where each grid box is colored in with the forecast category with the highest probability: red for above average, blue for below average, and dark gray for near-average. White shows “equal chances:” places where the odds for any of the three outcomes were equal.
This type of verification is like evaluating your performance in a game of Battleship. How many of your predictions were “hits” and how many were “misses”? If you had a strategy with your predictions, would you have been better off randomly guessing? In Battleship, we are hoping that our strategy results in a board littered with the wreckage of our opponents ships. With seasonal predictions, we are hoping that our forecasts (and the strategy behind them) are better than random chance (33% chance that reality is one of three categories: above, below, or near-average). Basically, one major goal of forecasting is to make sure we do better than the 33% of “hits” that would occur purely at random.
The HSS compares the number of grid points that are “hits” minus the number of grid points that are hits thanks to random chance to the total number of grid points minus random chance. This number is then multiplied by 100. A perfect forecast (HSS = 100) would mean that the forecast for every grid point is a hit. A bad forecast will be negative since the number of forecast “hits” is less than the number expected from just randomly guessing (1).
Now, if you’ve ever looked at one of the seasonal forecasts, you will notice areas marked EC (“Equal Chance” for any of the three categories). How do scientists and the HSS deal with this wrinkle?
Two ways: 1. for any point that has an equal chance forecast, we count it as 1/3 of a hit, which is equal to the chance that you would be right at random. 2. forget about any point with equal chance completely and calculate the HSS only for points where one of the three categories has the highest probability. This is referred to as the non-EC HSS (2).
What do these scores look like?
Figure 1 is the same as Figure 1 on my last post, just with the HSS and non-EC HSS calculated for each year. Any score > 0 means the forecast was better than a random guess. So how did your eyes do? Were their conclusions similar to the HSS metrics? Remember, first impressions can often be wrong.
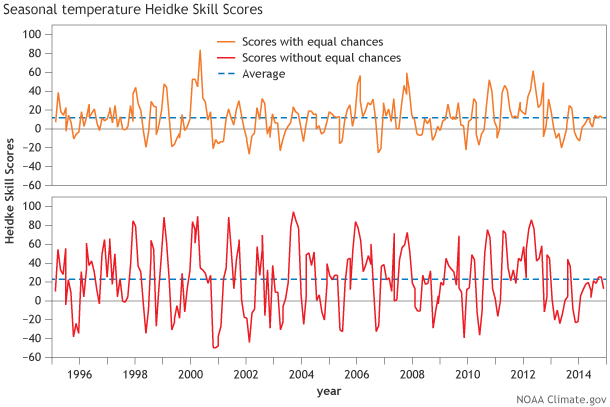
Figure 2. Heidke Skill Score (HSS) with EC (top) and without EC (bottom) averaged over the United States for every seasonal forecast from 1995 to present. On average, Heidke Skill Scores are above 0 (to be more exact, about 12% for HSS with EC and 22% for HSS without EC, as seen from the horizontal dotted lines), representing positive skill over random chance. You can play around with these verification metrics yourself here and here.
To look at this in a different way, Figure 2 shows the history of HSS and non-EC HSS for every seasonal temperature forecast (not just DJF) dating back to 1995. There is a ton of variability in the scores with forecasts made a month apart, jumping from skillful to “you would have been better off with a three sided die.” However, on average, seasonal forecasts do have HSS and non-EC HSS values above zero. You can check out the HSSs for other CPC products (6-10 day, 8-14 day, monthly forecasts) on our website here and here.
But there are even MORE ways to evaluate how our forecasts did other than showing a time series. HSS maps can be created by averaging HSS over time in order to show locations over the United States where the forecasts do better. Figure 3 shows where in the US the temperature seasonal forecasts are best, on average. Good news if you live in the Southwest US, but not such good news if you find yourself living in the central plains.
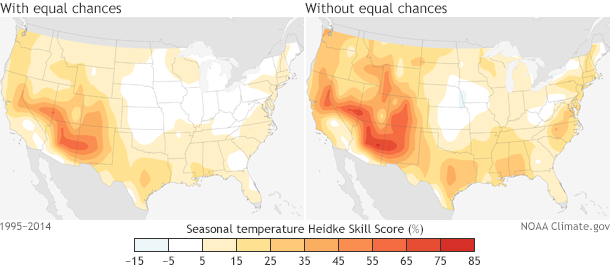
Figure 3: (left) Heidke Skill Score with EC and (right) Heidke Skill Score without EC averaged over every seasonal forecast from the period 1995-2014 for the United States. The highest skill for both scores is located over the desert Southwest.
If you want to learn more about the intricacies behind these forecasts, please check out the journal article “An Analysis of CPC’s Operational 0.5-Month Lead Seasonal Outlooks” by Peitao Peng, Arun Kumar, ENSO Blog guest blogger Michael Halpert and the ENSO Blog’s own Anthony Barnston. Full warning, it is a bit wonky (Peng et al. 2012). Otherwise stay tuned, because…
Next month I will discuss how we take into account not just the “hits,” but also the forecast probabilities that accompany each seasonal forecast. For that, scientists at the CPC use other metrics called the Ranked Probability Skill Score and Reliability Diagrams. These help shed light on other aspects of seasonal forecasts that would remain in the dark if the HSS were used alone. For example, when we forecast a 50% chance for above-average temperatures, does it actually happen 50% of the time?
Footnotes
(1) HSS = ((H-E)x100)/ (T-E) where H = number of grid points that are “hits”, E = number of grid points that are “hits” by random chance (the total number of points divided by 3 since there are three categories) and T = the total number of grid points. A perfect forecast (HSS = 100) occurs when H = T. A bad forecast will be negative when H < E.
(2) While seemingly similar, these two methods actually reward different ways of forecasting. Since the non-EC HSS only validates areas where the outlook is different than EC, it can be maximized by a forecaster making a prediction only over small regions where his/her confidence is highest. The HSS that includes areas with EC would be maximized if a forecaster makes non-EC predictions wherever he/she thinks there is a signal, regardless of confidence. The non-EC HSS favors caution. The HSS with EC favors risk. Also, by definition, the absolute value of the non-EC HSS is always higher than or equal to the absolute value of the HSS with EC.
References
Heidke, P., 1926: Berechnung der erfolges und der gute der windstarkevorhersagen im sturmwarnungdienst. Geogr. Ann., 8, 301-349.
O’Lenic et al., 2008: Developments in operational long-range climate prediction at CPC. Wea. Forecasting, 23, 496-515.
Peng, P., A. Kumar, M. S. Halpert, and A. G. Barnston, 2012: An analysis of CPC's operational 0.5-month lead seasonal outlooks. Wea. Forecasting., 27, 898-917.
Comments
Re: Testing the model
RE: Re: Testing the model
Actually, a 14 x 14 grid of random numbers (-1,0, and 1) could sometimes tend to match the spatial pattern of reality, and in an extremely rare instance could equal it exactly. 14 is a smaller number than over 200, so getting some very good scores and some very bad scores would be more likely than when using over 200 random numbers. I think in your last question you are asking what would happen if our "random" forecasts were taken from actual observations of other years, where all of the other years had equal chances of being assigned as the observations for the year in question. If there were enough years in the record so that very, very many possibilities were possible, the skill score should come out to be extremely close to zero. But with only 20 to 30 years in the record more luck becomes possible, and the baseline score could come out noticeably positive or negative by chance. Using only other observed years' observations limits the number of possibilities quite a bit, while using computer-generated random numbers make is more fair and less vulnerable to good or bad luck in sampling. Also, in a smaller sample of years it would matter whether the year in question is allowed to be selected, or not (it would result in a perfect skill score). The bottom line here is that the method used should be the one that ensures to the greatest degree that the assignments are truly random.
Comments have been disabled on this article